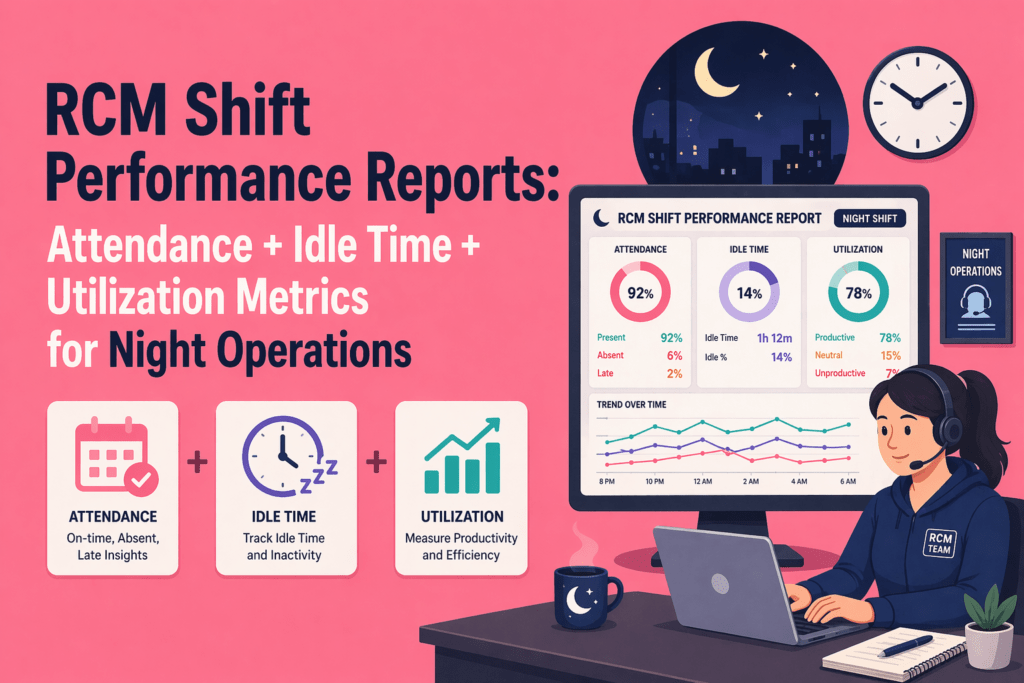
RCM Shift Performance Reports: Night Ops Metrics
Key Takeaways:
- To understand whether your team actually delivered, you need to analyze attendance, idle time, and utilization together.
- Attendance = coverage → Who showed up
- Idle time = friction → Where time was lost or blocked
- Utilization = execution → How effectively time was used
- High attendance does not guarantee productivity
- Idle time can indicate process issues, not just poor performance
- Utilization must be interpreted by role and shift context
- Poor handoffs from day shift often reduce night-shift efficiency
- Leading indicators (idle spikes, low utilization, missed logins) reveal problems before KPIs drop
- A strong RCM shift performance report helps you:
- Spot bottlenecks early
- Fix handoff gaps
- Improve staffing decisions
- Reduce revenue leakage
- If your reports only show who logged in, not how work actually happened, you are missing critical visibility.
- Tools like Flowace bring attendance, idle time, and utilization into one unified view, helping you manage night operations with clarity instead of guesswork.
When your teams run around the clock, night shift becomes the fragile link in your workflow. A simple attendance log cannot tell you whether the team actually moved denials forward or cleared the follow‑up queue. That is why RCM productivity monitoring built around night shift insight is emerging as a priority.
In this article, you’ll learn how to read attendance, idle time and utilization together, why it matters, and how Flowace’s reporting approach can help you see what’s really happening when you aren’t looking.
Why is night-shift RCM performance harder to measure than day operations?
Night operations are where things quietly break down in the revenue cycle. You have limited real-time supervision, so when an agent gets stuck on a claim or needs clarification, there is often no one available to step in. What would be a quick fix during the day can turn into hours of delay overnight.
Night shifts usually run lean, so even one absence can disrupt follow-ups, delay payer communication, and push your accounts receivable days higher.
Handoffs from the day shift can also distort night performance. If the day team does not clearly document denial actions or prep work queues properly, your night team starts at a disadvantage. Instead of executing, they spend valuable time trying to figure out what has already been done and what needs to happen next.
Most teams try to manage this with attendance data, but that only tells you who logged in. It does not tell you whether meaningful work happened or where execution broke down. And the pressure is not easing. According to the American Academy of Professional Coders (AAPC), 63 percent of providers report staffing gaps, and improving operational efficiency remains a top priority for leadership.
At night, those same challenges become more visible and more costly. If you want control over performance, you need more than a basic punch-clock view. You need visibility into how work is actually getting done.
How do I evaluate night‑shift performance in an RCM team?
Evaluating a night shift requires a shift in mindset. Instead of asking “Was everyone present?” ask “Did the shift cover the work it was assigned, and did that time convert into productive outcomes?” The process involves four steps.

Start with coverage metrics
Coverage metrics help you answer whether the shift was staffed properly. Look at your scheduled headcount versus actual headcount, on‑time login rates, late starts, and early logouts. Adherence to the assigned schedule is critical for the night shift because small variations can leave claims unattended for hours.
Then look at conversion metrics
Evaluate active hours versus idle hours, productive time, utilization rates, and how many accounts were touched or follow‑ups completed. Employee engagement data from Gallup show that global engagement fell from 23 % to 21 % in 2024, and engagement has a direct impact on productivity. If your night team is idle or switching between tasks without actually closing claims, low utilization will show it. Incorporate these metrics into your RCM productivity monitoring so you can act early.
Read the metrics together, not in isolation
Individual metrics can be misleading. Use a report‑reading matrix:
- High attendance + high idle: Everyone logged in but little active work occurred. Perhaps the day team did not load enough accounts for night processing or there were system outages.
- Low attendance + high utilization: The team that did show up worked hard. This pattern may signal understaffing and risk burnout.
- Good attendance + low utilization: People were present but not converting time into meaningful work. Check for process bottlenecks or knowledge gaps.
- High idle at certain hours: Idle spikes only at specific times may indicate queue starvation after handoff or when payer portals are down.
These patterns help you go beyond a binary view of good or bad performance.
Separate role‑specific expectations
Every team within the revenue cycle may not have the same utilization targets. Denial management teams must read payer policies, draft appeals, and coordinate with clinical staff, so they will naturally have more idle time than a payment posting team. Similarly, AR follow‑up specialists may have to wait on payer portals or phone queues. Assigning role-based productivity benchmarks ensures you evaluate fairly and coach effectively.
Why attendance alone does not tell you if a night shift performed well
Attendance is a basic coverage metric, but it is not the same as productive output. A full shift can still underperform operationally if staff spend most of their time waiting for claims to load, clarifying notes, or working on tasks outside the core RCM process.
Research shows that the average office worker spends only 2 hours 53 minutes of focused work in an 8‑hour day. If you rely solely on who showed up, you may overlook hours lost to friction. Attendance logs also fail to differentiate between active follow‑up time and time spent on administrative activities such as training or internal meetings. In short, presence is necessary but not sufficient.
Attendance, idle time and utilization are not separate reports. They are one shift story
To truly understand night performance, you need to see how attendance, idle time and utilization interact. Think of the night‑shift waterfall:
Scheduled hours → Logged‑in hours → Active hours → Productive hours → Utilized hours.
Attendance tells you whether your scheduled coverage materialized. Idle time shows where time was lost or blocked. Utilization shows how much of the available time became useful work. By walking through each stage you can identify whether issues stem from absenteeism, late logins, long idle blocks, non‑productive tasks or low work conversion. In an environment where revenue leakage rose 25 % from 2024 to 2025 and hospitals missed $48.4 billion in potential revenue due to denials, seeing each stage of work conversion is critical.
False idle vs true idle in night‑shift RCM operations
In RCM operations, idle time is an important signal, but not all idle time is bad.
When idle time is caused by process friction
Sometimes agents wait because of external delays: payer portals are down, the work queue is empty, or approvals are pending. Denial managers often have to pause while waiting on clinical notes. In these cases, “idle” does not reflect laziness; it shows systemic bottlenecks.
When idle time reflects misconfiguration
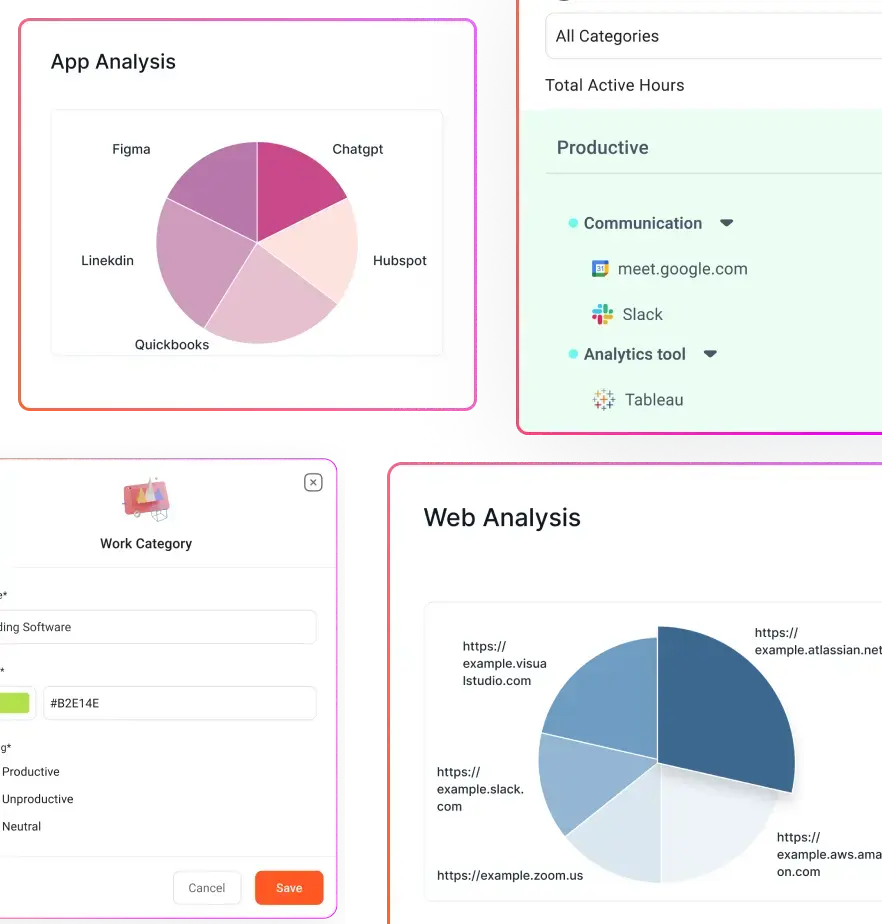
Idle spikes can appear when the tracking system misclassifies legitimate work. Internal huddles, training sessions, or time spent on calling activities may be flagged as idle if the software looks only at keyboard or mouse activity. A good RCM productivity monitoring setup lets you categorize these activities properly. Flowace, for example, allows managers to create custom work categories and configure productivity ratings so that training or meeting time is counted appropriately.
When idle time is a real performance issue
Of course there are times when idle time indicates poor performance: repeated disengagement, long unexplained inactive blocks or recurring exceptions without operational cause. These patterns should prompt coaching conversations or workload adjustments.
Utilization metrics for night operations: what should RCM leaders actually track?

Utilization helps you see whether available time translates into productive work. Here are the key metrics:
Active time percentage
Active time is the portion of logged‑in hours spent working on RCM tasks. By comparing active time to scheduled hours you see how much of your coverage is converting into effort.
Productive utilization percentage
Not all active time is created equal. Productive utilization measures the share of active time spent on revenue‑generating tasks (such as claim follow‑up, denial resolution or payment posting) rather than administrative tasks. Knowing your productive utilization helps you identify whether your team is doing the right work.
Utilization by role, team and shift
Break down utilization across roles and shifts. Payment posting teams might achieve 90 % utilization because their work is straightforward, while denial appeals teams might hover at 60–70 % because of research requirements. Evaluate by shift to see whether night performance differs from day performance.
Utilization trends by hour, not just by day
Hour‑by‑hour heatmaps reveal ramp‑up periods, mid‑shift lulls and pre‑handoff slowdowns. For example, high utilization at the start of the shift that drops after midnight may indicate that not enough new work is available. Such trends help you adjust shift handoff timing and queue assignments.
High utilization is not always good if coverage is too thin
A few highly utilized employees may mask weak shift‑wide coverage. In the Gallup report, manager engagement dropped from 30 % to 27 %, while individual contributor engagement remained flat. Over‑reliance on a small group of high performers can lead to burnout and turnover. Sustainable utilization must be achieved at team level, not just through star performers.
What a strong RCM shift performance report should include
Leaders need a complete view to act. A robust night‑shift report should contain the following:
Shift adherence metrics
Capture scheduled versus actual attendance, on‑time logins, missed logins and early exits. This baseline ensures you have the coverage needed for throughput.
Activity and idle analysis
Track active time, idle time and repeated idle spikes. Use hour‑by‑hour heatmaps to visualize when idle patterns occur. Distinguish between process friction, idle time and avoidable idle time (you can set guardrails to prevent idle time false positives)to avoid misinterpretations.
Utilization and output indicators
Measure productive time, utilization percentages and work completed versus expected. Look for untouched queues or follow‑up gaps, which can indicate bottlenecks or unclear ownership.
Exception and trend visibility
Highlight repeated late starts, recurring handoff gaps, team‑level patterns and comparisons across nights. This helps identify systemic issues rather than isolated incidents.
The hidden problem with night‑shift reports: handoff leakage
One of the most overlooked issues in RCM night shift team is handoff leakage. Day‑shift issues often show up as night‑shift underperformance: incomplete notes, unclear queue ownership or unresolved denials passed along too late.
Without clear handoff protocols, night teams waste time looking up claim histories and verifying earlier actions. Reports that highlight work left undone, unresolved exceptions and missing context are invaluable in preventing this leakage.
Leading indicators vs lagging indicators in night‑shift RCM performance
Night‑shift metrics must include both lagging and leading indicators.
Lagging indicators show the outcome
These include collections, backlog, denial rate and days in accounts receivable (A/R). They are important for financial reporting but appear after the damage is done. For example, in 2025 final denial rates rose to 2.7% and teams lost billions due to revenue leakage. By the time your month‑end reports surface these numbers, it’s too late to recover the lost revenue.
Leading indicators show the shift is drifting before outcomes worsen
Leading indicators include missed logins, rising idle clusters, low utilization, handoff leakage and untouched accounts. A February 2026 survey found that denials and underpayments are the top obstacle for 62% of RCM leaders and that 38 % lack real‑time data on payer performance. Monitoring leading indicators gives you early warning so you can adjust staffing, provide coaching or reassign work before financial metrics deteriorate.
What kind of software/reporting setup gives me this visibility?
To achieve comprehensive night‑shift insight, you need a toolset that pulls attendance, idle time and utilization into a single dashboard. Key criteria include:
You need shift‑level reporting, not just daily attendance summaries
Most payroll systems produce daily totals. You need hour‑by‑hour shift metrics to see when idle spikes or coverage gaps occur.
You need attendance, idle time and utilization in one dashboard
Separate systems create data silos. Look for a platform that automatically tracks attendance and activity, classifies work into productive and idle segments, and calculates utilization in real time.
You need role‑based productivity logic
Different teams have different workflows. Your software must allow you to define productivity categories so that training time, meetings and research are properly accounted for. Flowace’s standard plan offers configurable productivity ratings and custom work categories.
You need hour‑by‑hour and trend‑based visibility
Graphs and heatmaps should show utilization by hour and highlight trends across nights. This helps you plan staffing and adjust handoff timing.
You need exception alerts, not just static reports
The software should flag repeated late logins, prolonged idle periods and missed shifts automatically. Flowace’s AI‑powered custom alerts help managers react quickly.
You need reporting that helps managers observe and act
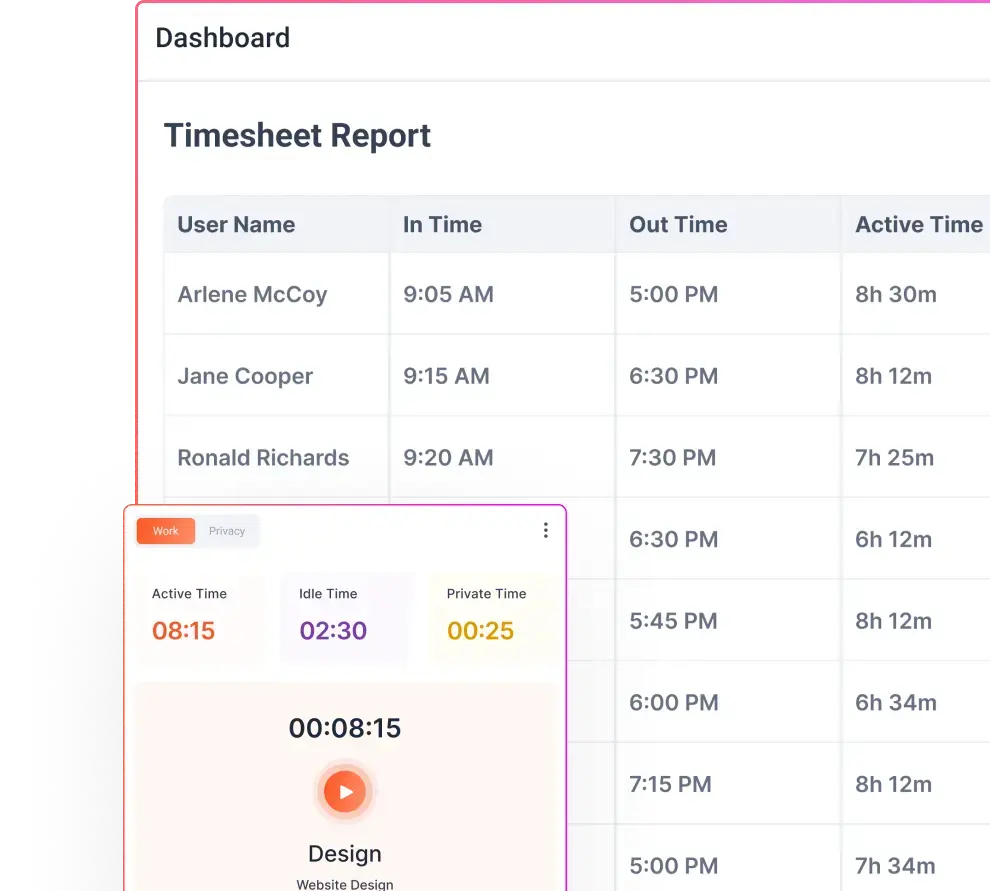
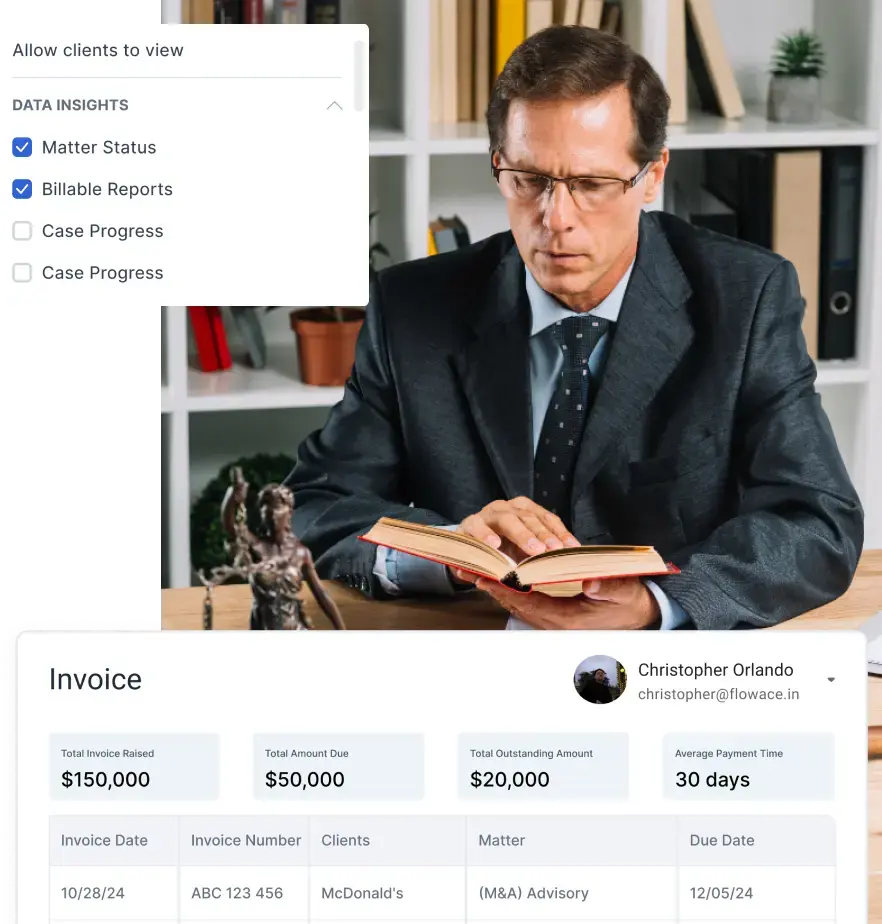
Data without context is useless. The tool should let you drill into individual cases, see which claims were delayed, and assign follow‑ups. Reports should be exportable for payroll and client billing.
How Flowace helps RCM teams build better shift performance reports
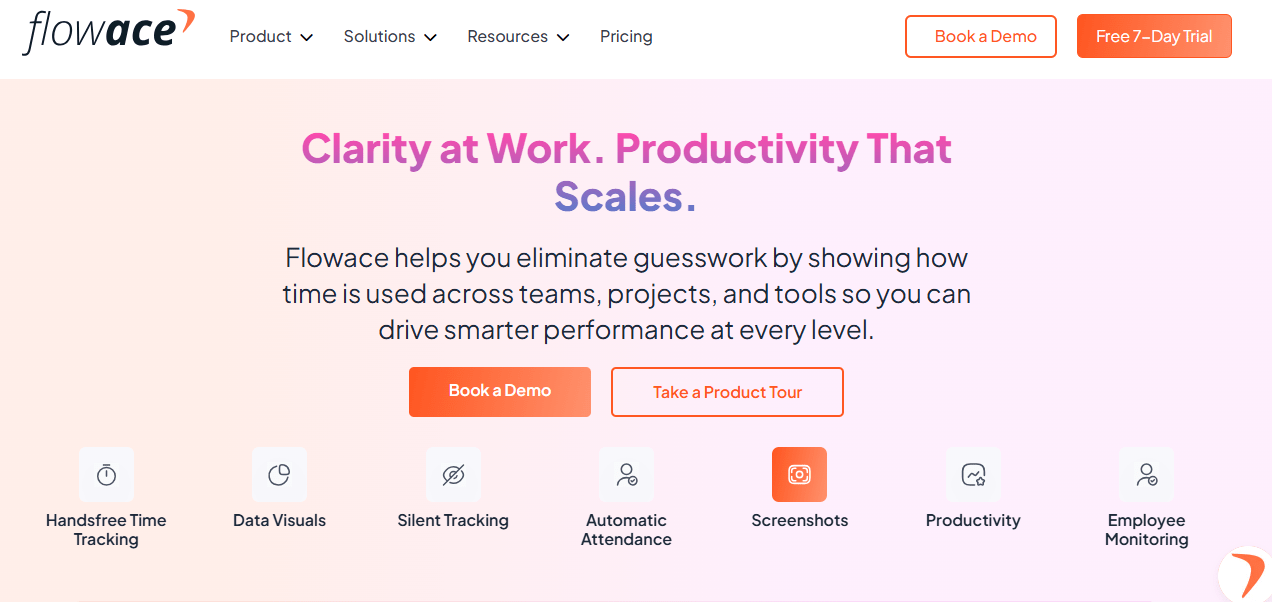
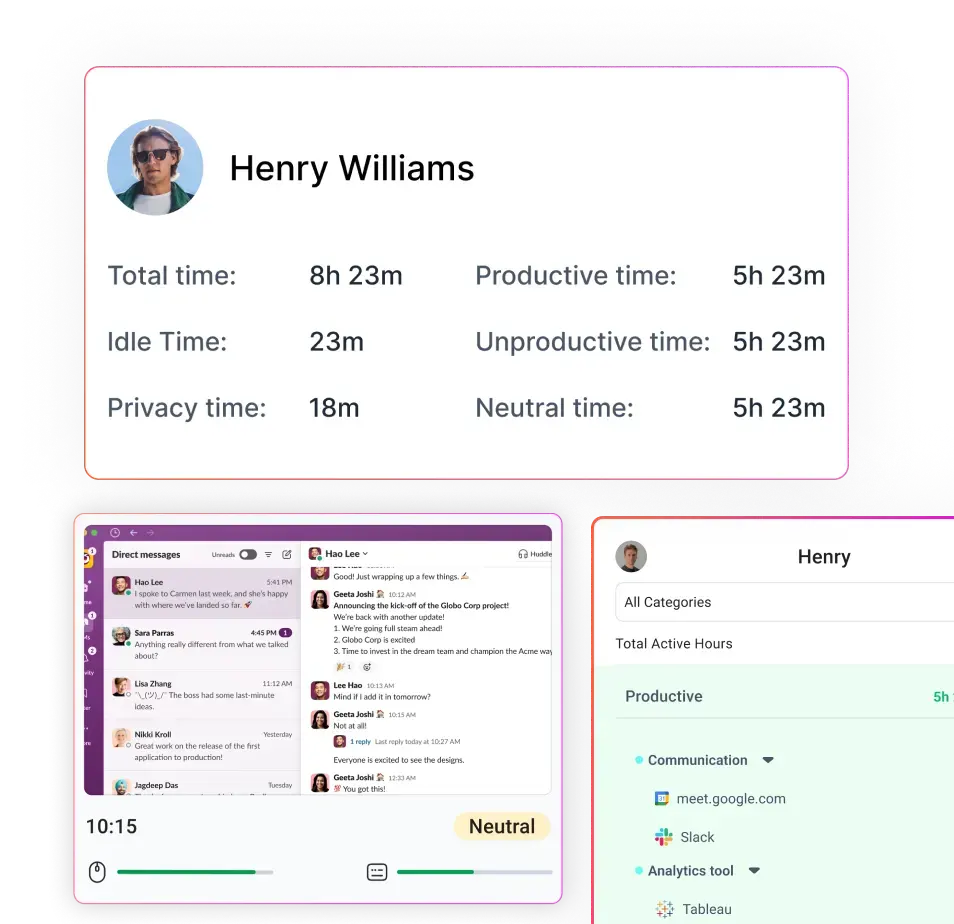
Flowace is an AI‑driven workforce analytics platform designed to automate time and attendance tracking. Here’s how it supports night‑shift productivity monitoring:
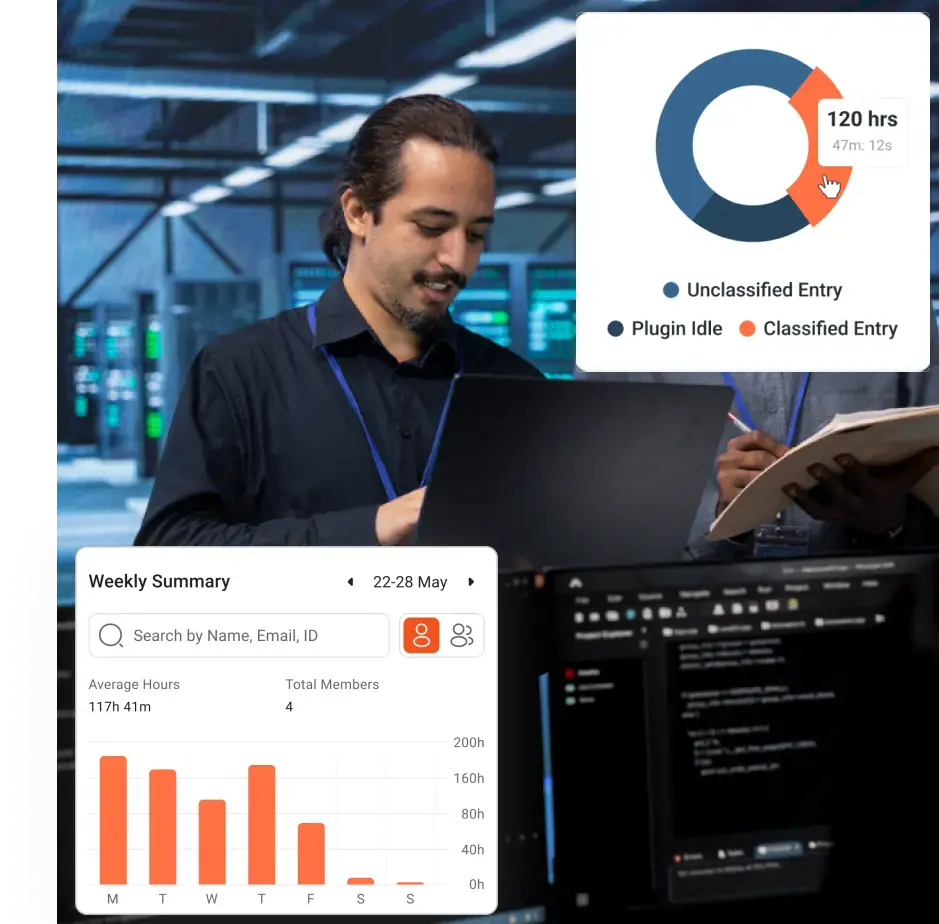
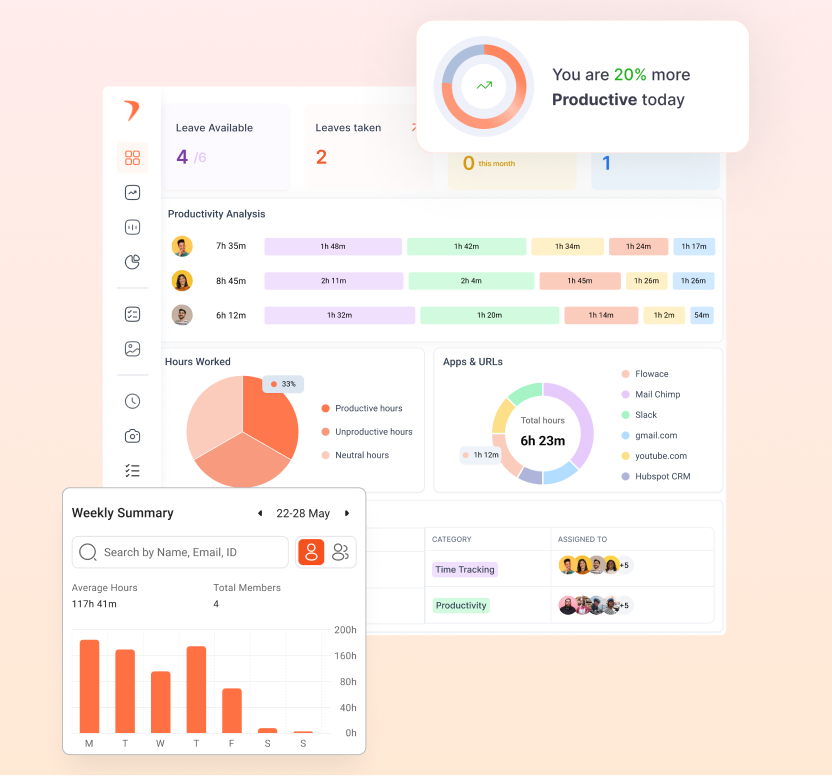
Unified visibility across attendance, idle time and utilization
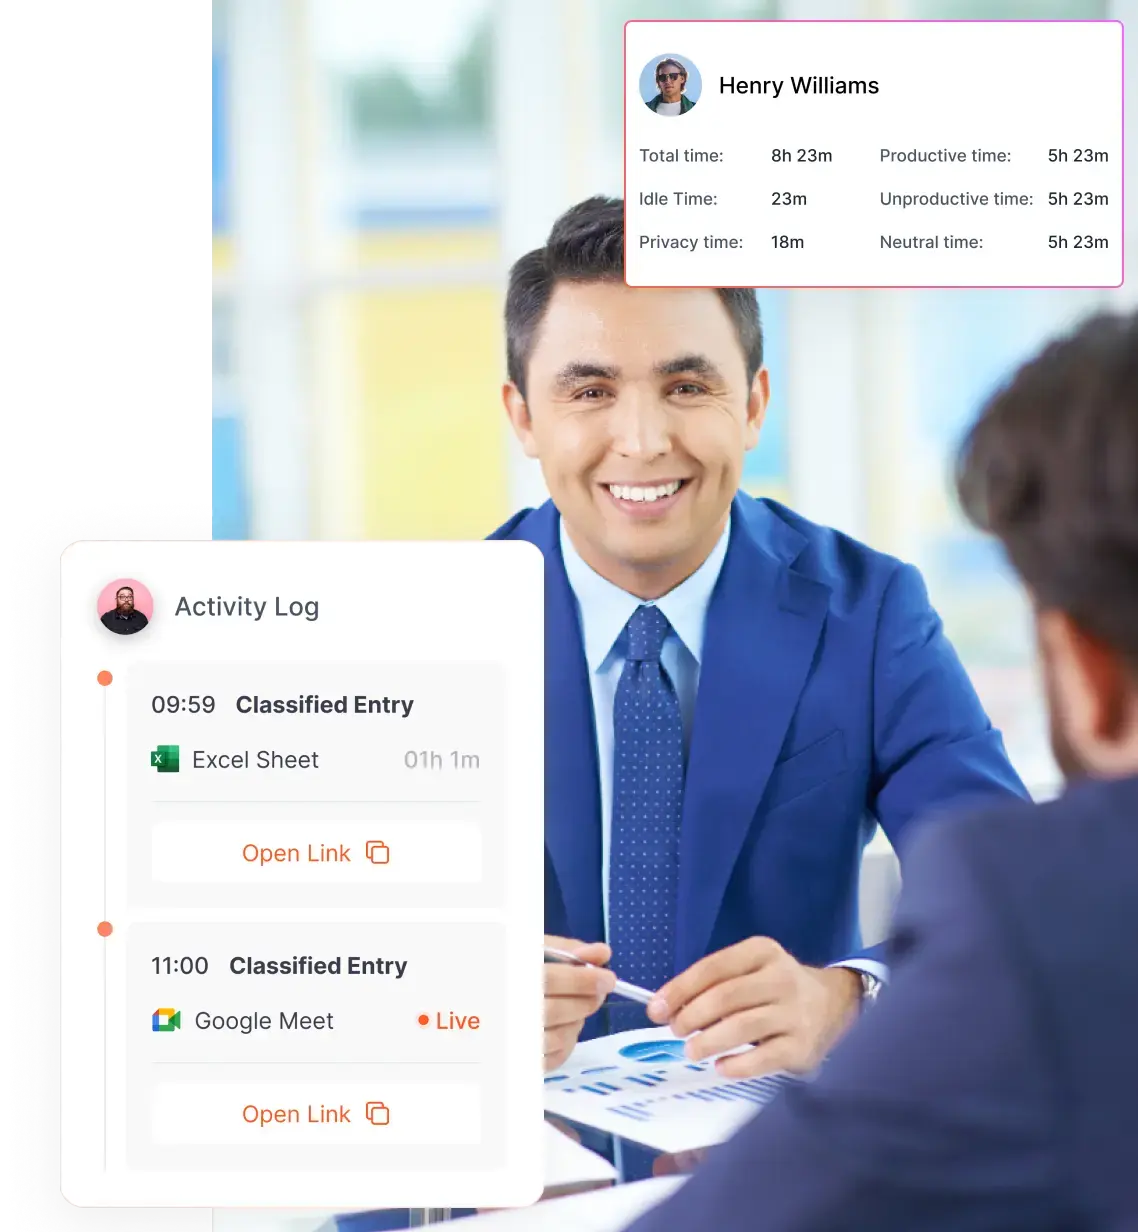
Flowace’s intelligent engine automatically recognizes tasks, applications and websites used during the day, classifies them, and presents a clear picture of productivity and utilization. There is no need for start‑stop timers; time is captured silently. Idle time is automatically discarded or categorized based on custom rules.
Role‑based productivity categorization for fairer analysis
Managers can configure productivity ratings at company, team and individual level, define custom work categories and adjust idle timeouts. This ensures that time spent on training or team huddles is counted appropriately.
Shift‑wise reporting for night operations
Flowace tracks time across Windows, Mac, Linux and virtual desktop environments. Its offline mode automatically syncs data when connectivity returns. This makes it ideal for offshore teams that may experience intermittent internet connections. The platform supports shift scheduling and weekly time off/holiday tracking, enabling accurate adherence and utilization calculations.
Exception tracking for late logins, idle spikes and missing hours
The software provides AI‑powered alerts when employees log in late, remain idle for too long or miss shifts. Higher‑frequency screenshots and keyboard/mouse activity tracking in the Premium plan help verify that work is actually happening
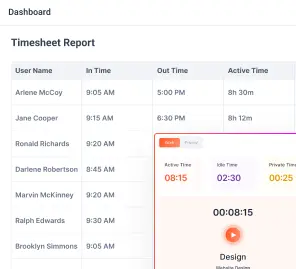
Better operational decisions without relying on manual timesheets or guesswork
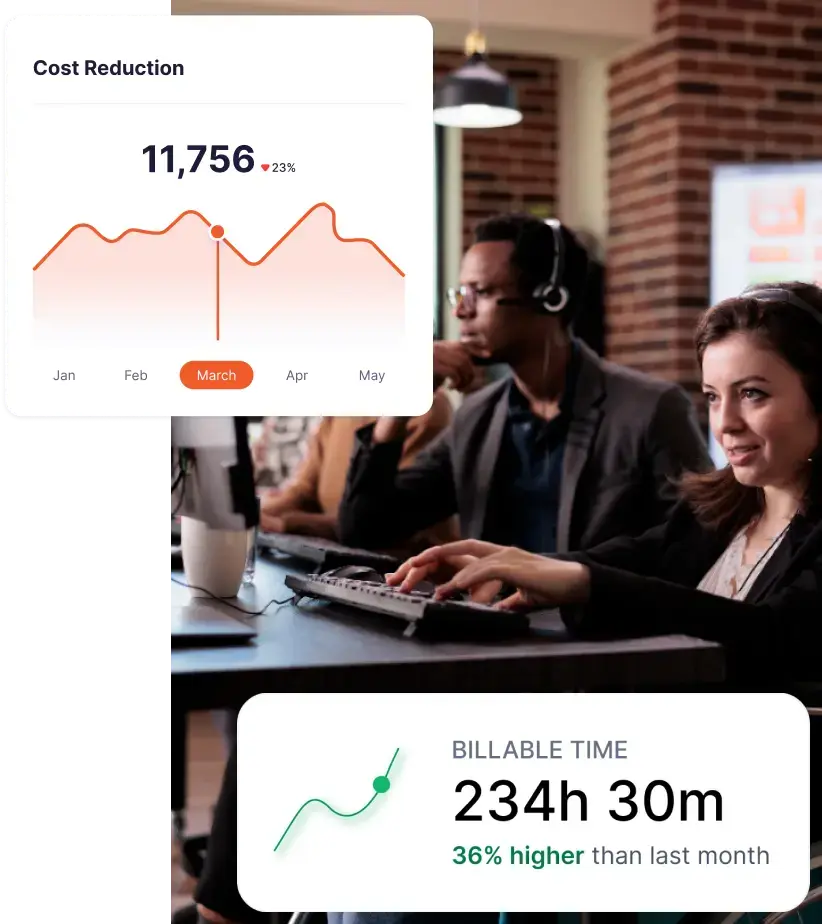
Flowace’s analytics platform offers visual dashboards and reports that tie effort to outcomes. Organizations using Flowace report up to a 31 % increase in productivity within three months and a 90 % reduction in manual timesheet effort. These improvements are especially valuable when night shifts operate with lean staffing.
What a good night‑shift report catches before the month‑end KPIs fall
An effective night‑shift report isn’t just historical; it’s predictive. It catches:
- Teams that are present but not productive – attendance is high but utilization is low.
- A few highly utilized employees masking weak shift‑wide coverage – indicates risk of burnout and hidden staffing issues.
- Recurring idle spikes during handoff windows – reveals process friction or queue starvation.
- Queue starvation or process bottlenecks that attendance reports miss – points to upstream issues causing revenue leakage.
By catching these patterns early, you can assign additional resources, adjust handoff timing or rework processes before your collection rate or denial metrics suffer.
Final takeaway
A strong RCM shift performance report does more than record attendance. It helps you understand whether the night shift had the right coverage, whether time was lost to friction or inactivity, and whether available hours translated into productive work. The combination of RCM productivity monitoring and night shift productivity tracking for RCM teams gives you the visibility you need to reduce denials, shorten A/R days, and boost revenue collection.
If your night‑shift reports still tell you who showed up but not how the shift actually performed, give Flowace a try. Its AI‑powered platform unifies attendance, idle time, and utilization into one clear operational view and provides role‑based analytics, privacy controls, and real‑time alerts.
Book a free demo to see how shift‑level reporting works in practice or start a free trial to evaluate it with your own RCM team.
FAQs:
How does RCM productivity monitoring differ from standard time tracking?
Standard time tracking records when someone logged in. RCM productivity monitoring goes further by categorizing tasks, measuring active and idle time, and connecting time spent to outcomes like claims processed, denials overturned and A/R days. It helps you see whether your team is actually advancing revenue cycle goals instead of simply being present.
Why is night shift productivity tracking for RCM teams critical?
Night shifts often operate with minimal supervision and smaller teams. Small inefficiencies can snowball into missed follow‑ups or increased denials. Tracking productivity overnight ensures that coverage gaps, idle spikes or handoff issues are detected early, protecting revenue and patient satisfaction.
What metrics should be included in a night‑shift RCM report?
Key metrics include scheduled vs. actual attendance, on‑time logins, active time, idle time, productive utilization, completed follow‑ups, untouched queues and exception trends. Hour‑by‑hour heatmaps help visualize idle spikes and handoff issues.
How can I tell whether idle time is due to process friction or poor performance?
Compare idle patterns to handoff timing and payer portal availability. If idle spikes occur after handoffs or during known portal downtimes, they likely reflect process friction. If idle time occurs randomly or is concentrated with specific agents, it may indicate disengagement or misallocation of tasks.
How does Flowace protect employee privacy?
Flowace offers silent tracking or interactive privacy modes, lets admins exclude personal apps and configure retention policies, and allows employees to see what is being recorded. This balance fosters transparency while respecting privacy.
Can Flowace integrate with my existing RCM and payroll systems?
Yes. Flowace integrates with project tools like Jira, Asana and Trello, HR systems like BambooHR and Zoho People, and communication platforms like Slack and Microsoft Teams. This ensures productivity data flows into your existing workflows.