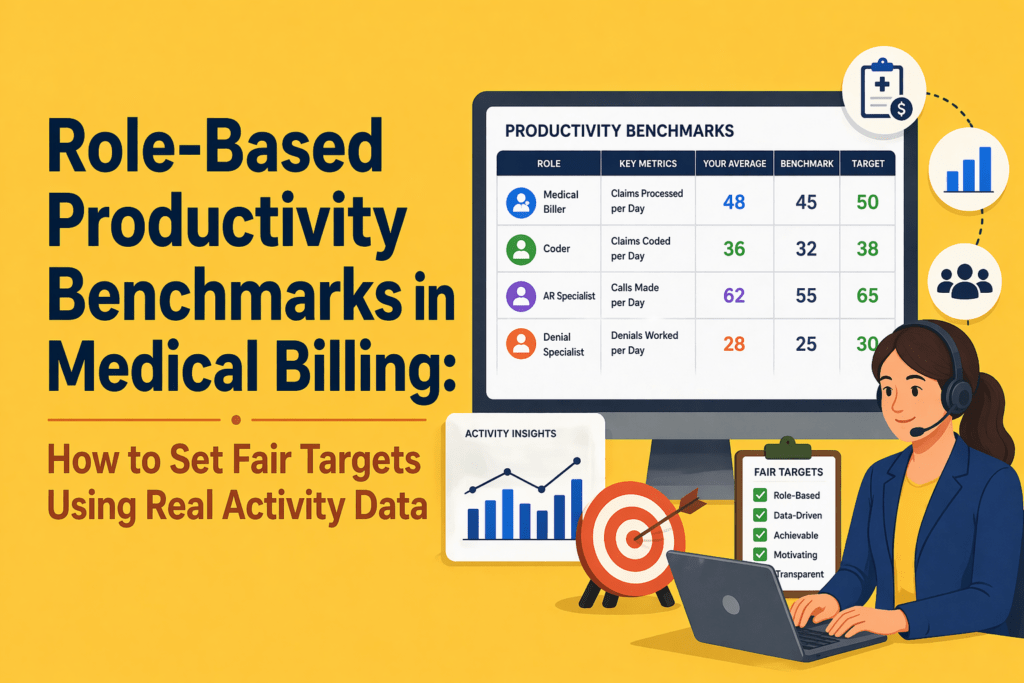
Role-Based Productivity Benchmarks in Medical Billing
Key Takeaways:
- One-size-fits-all productivity targets don’t work. Different billing roles require different benchmarks.
- Volume alone is misleading. High output without quality creates rework and revenue leakage.
- Outcome metrics (denials, A/R, collections) show results, but not the effort behind them.
- Effort metrics (handling time, touches, rework) reveal how work actually happens.
- Fair benchmarks combine both outcome and effort metrics for a complete performance view.
- A large part of billing work is invisible and often ignored in traditional KPIs.
- Role-based benchmarks improve fairness, trust, and performance management.
- Real activity data is essential. Manual tracking and assumptions lead to poor benchmarks.
- Use a structured approach: segment roles, baseline activity, adjust for complexity, and set benchmark ranges.
- Better benchmarks lead to lower denials, less rework, stronger team morale, and improved revenue cycle outcomes.
A denial specialist, charge‑entry representative, and medical coder don’t do the same type of work. Yet their efficiency is often measured through the same blunt outputs and department‑level KPIs. That inconsistency hides opportunities for improvement.
A 2026 Tebra benchmark survey of 190 medical billing companies found that 46% of billing companies saw denial rates increase over the previous year, while the median first‑pass acceptance rate held at 85% and less than half of firms achieved a 90% pass rate. Nearly 77% of billing companies operate on client‑owned or mixed systems and 54% expect gross margins at 10% or below, highlighting how tight margins and fragmented workflows compound the pressure on staff.
Your teams are struggling because generic productivity targets often measure the wrong outcomes. They focus on outcomes like “claims processed per day” without accounting for the complexity and effort behind that. They ignore invisible tasks such as eligibility checks, clarification loops, and denial appeals. They lump high‑volume, low‑complexity tasks together with low‑volume, high‑complexity work. They fail to distinguish seasoned staff from new hires.
This article explains how to build fair, role‑based productivity benchmarks using real activity data. By combining traditional outcome metrics with effort metrics, you can set targets that reflect how work actually happens, which improves efficiency in medical billing.
Why Generic Medical Billing Productivity Targets Fail?

When the same benchmarks are applied across different specialties, payer mixes, and claim complexities, they measure activity rather than effectiveness. The result is a system that looks productive on paper but quietly erodes revenue, morale, and long-term performance.
Different billing roles create value in different ways
RCM teams are composed of specialists. Charge‑entry staff focus on collecting charge data from clinical encounters and preparing claims; their throughput is influenced by documentation quality and coding clarity. Coders review charts and assign CPT/ICD codes; their productivity depends on encounter complexity and the specificity captured. Payment posting teams reconcile payments, resolve variances and ensure accounts are balanced. A/R follow‑up and denial management staff chase unpaid claims, file appeals and answer payor requests.
Measuring everyone against the same daily “claims‑processed” number ignores these differences.
When MGMA surveyed medical groups in early 2026, leaders noted that productivity isn’t a single measure – work RVUs, encounters, collections and access measures all tell part of the story. Only 60 % of physician groups said productivity in 2025 was on target or exceeded expectations, while 40 % were below goal. In other words, even provider organizations struggle when expectations aren’t aligned with work types.
Raw output alone creates misleading comparisons
The “charts per day” metric remains common in coding departments, but it often rewards speed over accuracy. But coders racing to hit high‑volume targets skip documentation queries and accept the first plausible code, leading to denial exposure and compliance risk.
Volume metrics also ignore complexity; coding an outpatient visit is very different from coding an inpatient surgery involving multiple comorbidities.
Blanket benchmarks distort behaviour and damage trust
Coders may avoid specificity to stay on pace, leaving money on the table. Charge‑entry teams may ignore warning edits to meet quota, leading to denied claims. Payment posters may misclassify exceptions to reach a daily transaction count. These behaviours create friction between managers and staff. MGMA’s 2026 poll found that when productivity slipped, the ripple effects included longer wait times, schedule reshuffling, and heavier workloads across front‑desk and coding teams.
As a result, staff morale suffers. They feel punished for doing the right thing. Managers also lose credibility when benchmarks don’t reflect the realities of the work.
The real shift: from generic targets to fair, role‑based benchmarks
Shifting from generic targets to role-based benchmarks helps move away from a single standard that fits no one to a goal that reflects what each role actually demands.
A role‑based productivity benchmark is a performance standard tailored to a specific job function. For example,
- Instead of expecting every A/R representative to handle 60 accounts per day, you set ranges for simple vs. complex accounts and track follow‑up intensity and resolution quality.
- Instead of measuring coders solely by charts coded, you blend volume with first‑pass acceptance, specificity capture and query response time.
- For charge entry, you evaluate claims entered, submission timeliness and edit rate.
- For payment posting, you measure transactions posted, exception management and reconciliation turnaround. These benchmarks are fair because they reflect the actual job scope and complexity.
Why medical billing needs role‑specific benchmark logic?

Patient acuity, payer rules, denial types and documentation quality all affect the effort needed to produce a claim. Many firms also operate on multiple client‑owned systems, creating workflow fragmentation and limited reporting.
Without role‑based benchmarks tied to real activity data, managers cannot see where the workload builds up and what improvements will have the biggest impact.
Traditional KPI lists focus on outcomes like days in A/R, denial rate, net collection rate and first‑pass acceptance rate. These metrics are essential; they show you what happened. However, they don’t tell you how much work it took. To set fair targets, you must pair outcome metrics with effort metrics.
Outcome metrics show the result
Outcome metrics include:
- Denial rate: percentage of claims denied on initial submission; best‑in‑class rates are <5 %.
- Clean claim rate: percentage of claims accepted without edits or resubmission; industry leaders aim for 95–98 %.
- Days in A/R: average days to collect revenue; top performers stay under 30 days.
- Net collection rate: percentage of allowable revenue collected; industry averages hover around 93–95 %.
- First‑pass acceptance rate: share of charts that pass billing edits; median is 85 % with less than half of firms achieving 90 %.
These numbers matter for cash flow. But they are lagging indicators. You learn about denial rate only after the claim is denied. You see days in A/R only after payment has been delayed. Outcome metrics alone cannot guide day‑to‑day staff management.
Effort metrics show the work behind the result
Effort metrics capture the inputs that drive outcomes. Examples include:
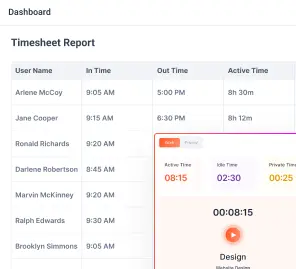
- Active handling time: minutes spent working on a claim or account.
- Touches per account: number of interactions required to resolve a claim; MGMA research found that 40 % of claims require zero touches, but each touch costs $2.50 to $8 in manual labour.
- Follow‑up intensity: frequency of follow‑ups on an account, distinguishing proactive touches from reminders.
- Rework volume: number of claims that require corrections or appeal due to errors or missing documentation.
- Exception frequency: count of claims that hit edits or require manual review.
- Documentation time: time spent clarifying orders, querying providers or updating notes.
- Portal switching time: minutes lost navigating multiple payer portals – invisible to volume metrics but a huge drain on productivity.
- Queue movement: how quickly claims move through work queues.
These metrics may be captured by automatic activity tracking systems rather than manual timesheets. Combining them with outcome metrics provides a complete view. For instance, a coder who produces many charts but triggers frequent exceptions may need training or support.
What real activity data reveals that traditional KPIs miss
Much of the revenue cycle happens outside of claims processing. Staff spend hours switching between payer portals, researching coverage, verifying eligibility, chasing documentation, responding to queries and preparing appeals. These tasks don’t always appear in volume reports. Yet they consume significant time and drive denials if overlooked.
Why “busy” is not always productive
Employees may appear busy but spend time waiting on provider responses, dealing with system slowdowns or correcting earlier mistakes. By measuring active handling time, portal switching and rework, managers can differentiate productive effort from wasted effort. Effort metrics also reveal when staff are burning extra hours to meet unrealistic targets, a warning sign of impending burnout.
Why self‑reported productivity isn’t enough
Manual timesheets and self‑reported productivity logs are subjective and often inaccurate. They rely on memory and can be gamed. A 2025 Human Medical Billing article noted that denial rates were expected to climb to 12–15 %, partly due to front‑end errors and documentation issues. Without objective activity data, organizations cannot pinpoint where those errors happen. Automated time‑tracking tools that capture apps, websites, and active work time remove subjectivity and provide granular insights into how work happens, enabling fair benchmarking.
What fair productivity benchmarks should account for in Medical Billing?
Before setting any performance standard, you need to understand the variables that define what “productive” actually looks like for that specific role and workload.
Role type
Each function needs its own benchmark model.
- Coders should be measured on charts coded, complexity mix, first‑pass acceptance rate and specificity capture.
- Charge‑entry teams should be evaluated on claims entered, submission lag and edit rate.
- Payment posting teams should be assessed by transactions posted, exception rate and reconciliation turnaround.
- A/R and denial teams need metrics on accounts touched, follow‑up intensity, resolution rate and aged‑bucket movement.
- Patient billing or support teams should be measured on accounts handled, documentation quality, resolution rate and call/wrap time.
Complexity mix
Your expectations should be set based on the complexity of the task and employee capacity. AMBCI’s 2025 coding benchmark report recommends adjusting productivity expectations by encounter type.
For example, primary care coders typically process 20–30 outpatient E/M encounters per hour, specialists handle 12–20 encounters per hour, surgical coders manage 5–8 cases per hour, and complex inpatient coders process 8–14 charts per day. New coders may reach only 60–75 % of senior benchmarks during their first six months. Benchmarks must therefore be stratified by complexity and experience.
Quality expectations
Speed without accuracy is a trap. AMBCI warns that modern benchmarks must integrate volume, complexity, accuracy and financial impact. Quality measures include first‑pass acceptance rate, denial rate, edit rate, variance resolution and rework volume. Setting a minimum quality threshold ensures that productivity improvements do not come at the expense of revenue or compliance.
Experience level and ramp stage
New hires need time to learn systems and payor rules. Their productivity should be benchmarked against early‑stage expectations rather than seasoned staff. Provide training and gradually raise targets as they master the workflow. Conversely, experienced staff may handle more complex work; their benchmarks should reflect this.
System friction and operational dependencies
Productivity can suffer due to external factors: payer portal downtime, EHR slowness, cross‑platform data entry, missing documentation, or staff shortages. Identify and address these frictions rather than penalize employees.
The tebra study indicates that when 67 % of billing companies believe payers use AI to increase denials, 73 % have not adopted robotic process automation, and 59 % have not adopted any AI. It’s clear that technology adoption and workflow standardization must be part of the benchmark discussion.
A practical framework for setting role‑based productivity benchmarks in Medical Billing
Building fair benchmarks requires a structured approach. Here is a six‑step framework your team can use.
Step 1: Segment work by role
Group employees based on core workflows rather than departments. Identify coders, charge‑entry specialists, payment posters, A/R follow‑up staff, denial specialists and patient billing representatives. For outsourced teams, consider segmenting by client type or specialty.
Step 2: Observe actual activity for 30 days
Before setting targets, collect 30 days of unbiased baseline data. Use automated time‑tracking tools to capture active handling time, apps used, websites visited, touches per account and types of tasks. Don’t use this data to discipline employees; use it to understand reality and build trust.
Step 3: Separate low‑, medium‑ and high‑complexity work
Classify tasks by complexity based on CPT/DRG codes, payer rules, documentation requirements and denial likelihood. For example, short form claims with few modifiers may be low complexity, while in‑patient surgeries with comorbidities are high complexity. Coders working on high‑complexity charts should have different throughput expectations than those on low‑complexity charts.
Step 4: Define benchmark bands, not a single rigid number
Instead of setting one target, create benchmark bands (e.g., acceptable, strong and exceptional). Use your baseline data to calculate median performance and top‑quartile performance for each role and complexity category. A coder working on simple outpatient charts might fall into the acceptable band at 20 charts per hour, strong at 25 and exceptional at 30. For high‑complexity inpatient charts, acceptable might be 8 charts per day, strong at 10 and exceptional at 14. Bands provide flexibility and encourage improvement without punishing staff who handle tougher cases.
Step 5: Validate productivity against quality and rework
Cross‑check benchmark candidates against quality metrics such as first‑pass acceptance, edit rate, denial rate and rework volume. A high throughput that generates above‑average denials should not be considered strong. Only benchmarks that meet or exceed quality thresholds should be adopted. This step reinforces that speed must accompany accuracy.
Step 6: Review and recalibrate regularly
Benchmarks are not static. As payer rules change, case mix shifts, technology evolves and teams grow, revisit the bands. Use rolling 90‑day reviews to update baseline data, adjust for seasonality (e.g., year‑end rush vs. summer lull) and incorporate new automation tools. Encourage staff feedback; fair benchmarks should be transparent and co‑developed, not imposed.
Role‑by‑role examples of fair benchmark design
Applying the framework requires role‑specific metrics. Below are examples of dimensions you might track.
Coders (medical coding productivity benchmarks)
- Charts coded: number of charts coded per hour/day. Adjust by encounter type; e.g., 20–30 outpatient E/M per hour vs. 8–14 complex inpatient charts per day.
- First‑pass acceptance rate: percentage of charts that pass editing on first submission. Target >90 %.
- Specificity capture: percentage of codes assigned at the highest supported specificity. Low specificity may indicate missed revenue.
- Query response time: average time providers take to respond to coder queries. Long response times delay billing and should be addressed via workflow improvements.
- Complexity mix: share of low, medium and high‑complexity cases.
Charge‑entry teams
- Claims entered: number of claims processed per day. Adjust for claim complexity and payer requirements.
- Submission timeliness: time from service date to claim submission. Aim to minimize lag while ensuring accuracy.
- Edit rate: percentage of claims hitting billing edits. Lower edit rates reflect clean data entry and proper coding.
- Lag from documentation to entry: time from final documentation to data entry completion.
Payment posting teams
- Transactions posted: number of payments applied per day.
- Exception rate: percentage of payments requiring manual intervention (e.g., variance resolution, partial postings).
- Reconciliation turnaround: time from payment posting to full reconciliation of accounts.
- Unresolved variance load: outstanding variances per day or per month.
A/R follow‑up teams (revenue cycle staff productivity benchmarks)
- Accounts touched: number of accounts reviewed or contacted per day. Adjust for account complexity and payer mix.
- Follow‑up intensity: number of touches per account; aim to minimize wasted touches by using efficient contact strategies.
- Active handling time vs. idle time: measure how much of the day is spent in active follow‑up versus waiting on payer or provider responses.
- Movement across aging buckets: reduction in 60-, 90- and 120‑day A/R. Use industry benchmarks; for example, NCDS notes that days in A/R should be under 40 for acceptable performance.
- Resolution contribution: net reduction in outstanding accounts, balanced against write‑offs.
Denial management teams
- Denials worked: number of denied claims addressed per day.
- Appeal progression: proportion of appeals successfully advanced and resolved.
- Root‑cause categorization quality: accuracy of identifying denial reasons. Top denial categories include eligibility/coverage issues (46 %) and documentation requests (42 %).
- Rework burden: volume of denials returned due to insufficient appeal documentation.
- Turnaround time: average time from denial receipt to resolution.
Patient billing or support teams
- Accounts handled: number of patient accounts managed per day (payment plans, billing inquiries, statements).
- Documentation quality: completeness and clarity of patient notes. Good documentation reduces call backs and improves patient satisfaction.
- Resolution rate: proportion of accounts closed or converted to payment plans.
- Call and wrap time: duration of calls plus time spent logging outcomes and following up.
These examples illustrate how role‑based benchmarks blend outcome and effort metrics. Your numbers will vary depending on specialty, payer mix and internal systems.
Common mistakes leaders make when setting productivity targets
Using only volume‑based goals
Volume goals encourage workers to game the system, skip quality checks and avoid complex cases. Don’t measure coders solely by charts per day or A/R reps solely by calls made. Always pair volume with quality and effort metrics.
Ignoring rework and downstream impact
Denials and rework cost money. First‑pass acceptance rate and specificity capture correlate directly with revenue. Don’t consider a high producer productive if their work generates denial queues or compliance risk.
Benchmarking roles against department averages
Department‑level averages hide wide variation in complexity and role type. Segment by role and complexity before setting targets.
Turning early benchmarks into punishment tools
During the baseline period, use data for learning, not discipline. Employees need to trust that benchmarks reflect reality and help them improve.
Mistaking friction for underperformance
Low output isn’t always an employee’s fault. Portal downtime, system slowness, documentation delays and payer policies can slow work. Identify and address these frictions; don’t penalize staff for systemic issues.
How Flowace helps medical billing teams build fairer productivity benchmarks

Flowace is an AI‑driven productivity and workforce analytics platform designed to capture real activity patterns without manual effort. Flowace’s ability to capture active work, idle time, app usage and offline tasks makes it ideal for building fair, role‑based benchmarks. Here’s how it addresses the challenges discussed earlier:
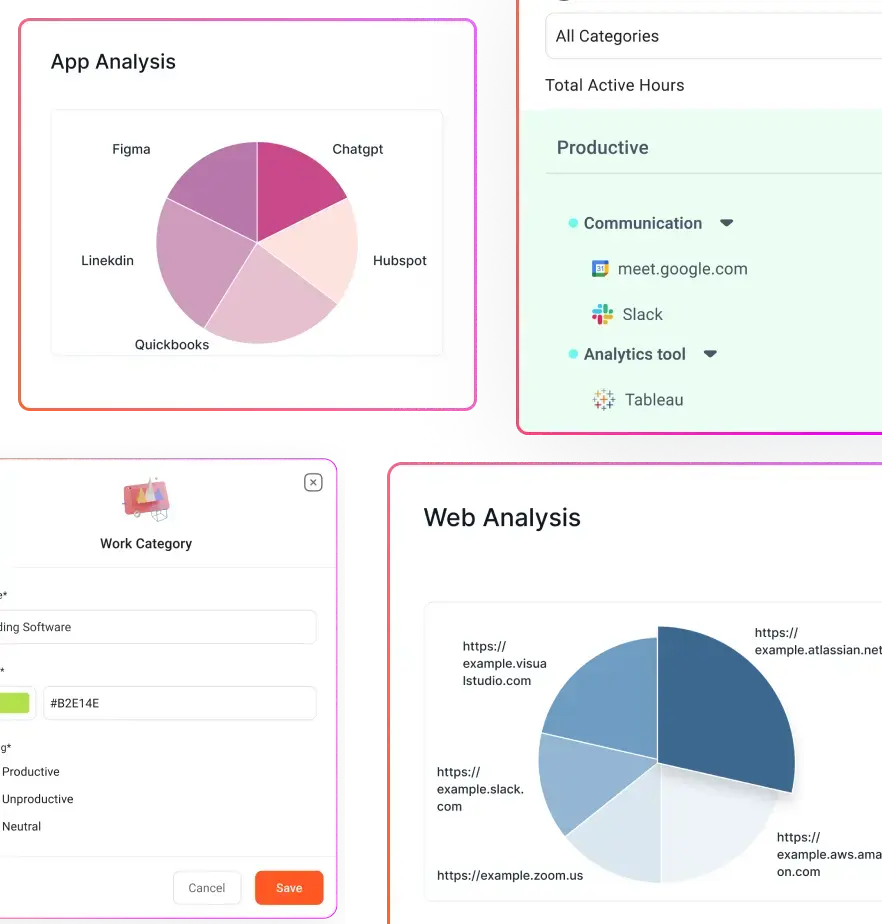
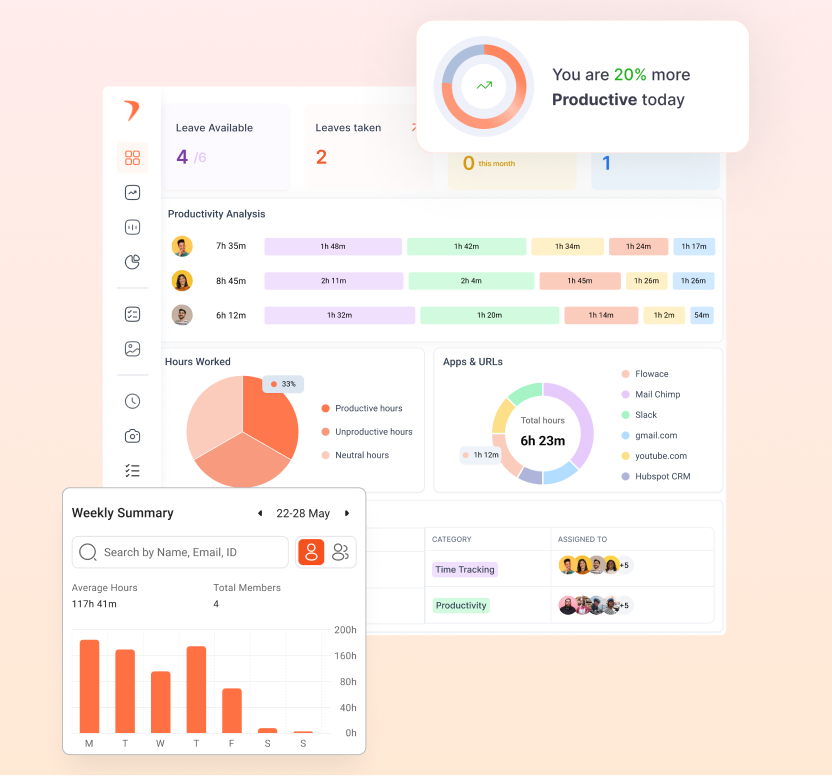
- Capture real activity patterns without guesswork: Flowace collects second‑by‑second activity logs and categorizes them by productive vs. non‑productive apps. Managers see how much time staff spend in billing software, payer portals, emails and spreadsheets. This data helps differentiate meaningful work from busy work and reveals invisible tasks.
- See role‑level work patterns, not just department totals: Because Flowace tracks activity at the individual level, you can segment by role and complexity. Compare coders working on outpatient cases with those handling complex inpatient charts. Understand which tasks consume the most time.
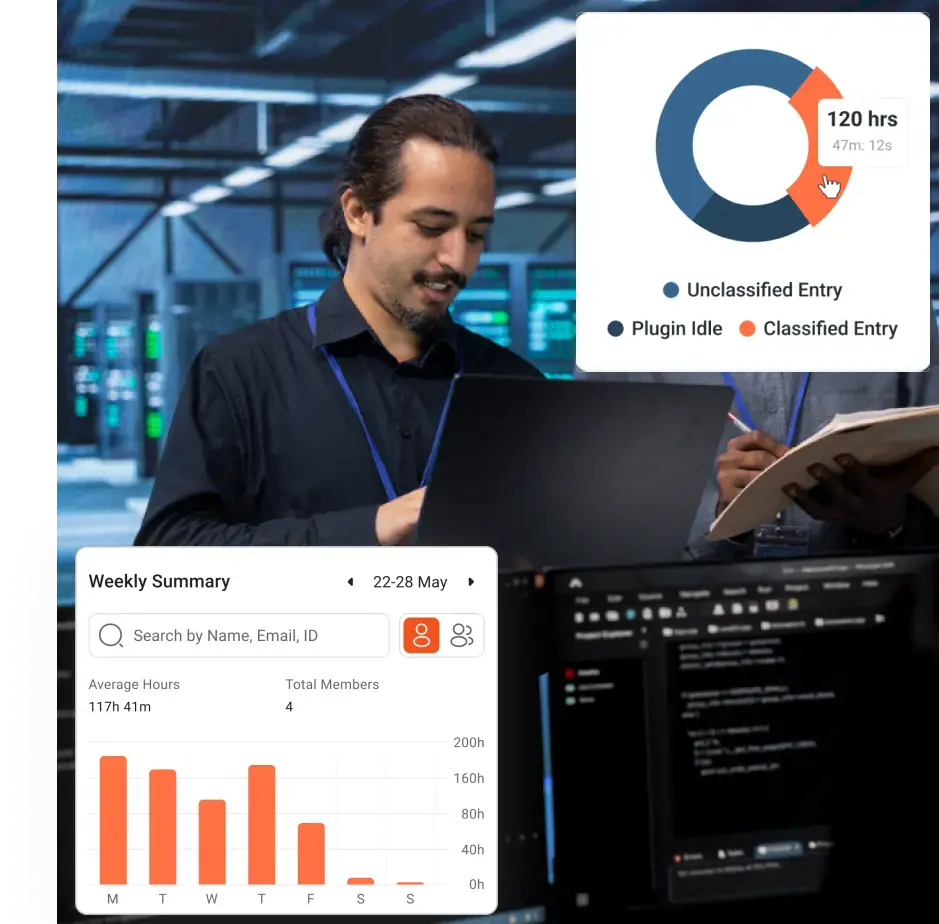
- Separate active work, idle time and workflow friction: Flowace reports show active handling time vs. idle or waiting time. If a coder’s activity is low because they’re waiting for query responses, managers can intervene. If an A/R rep spends half the day navigating payer portals, invest in automation or training.
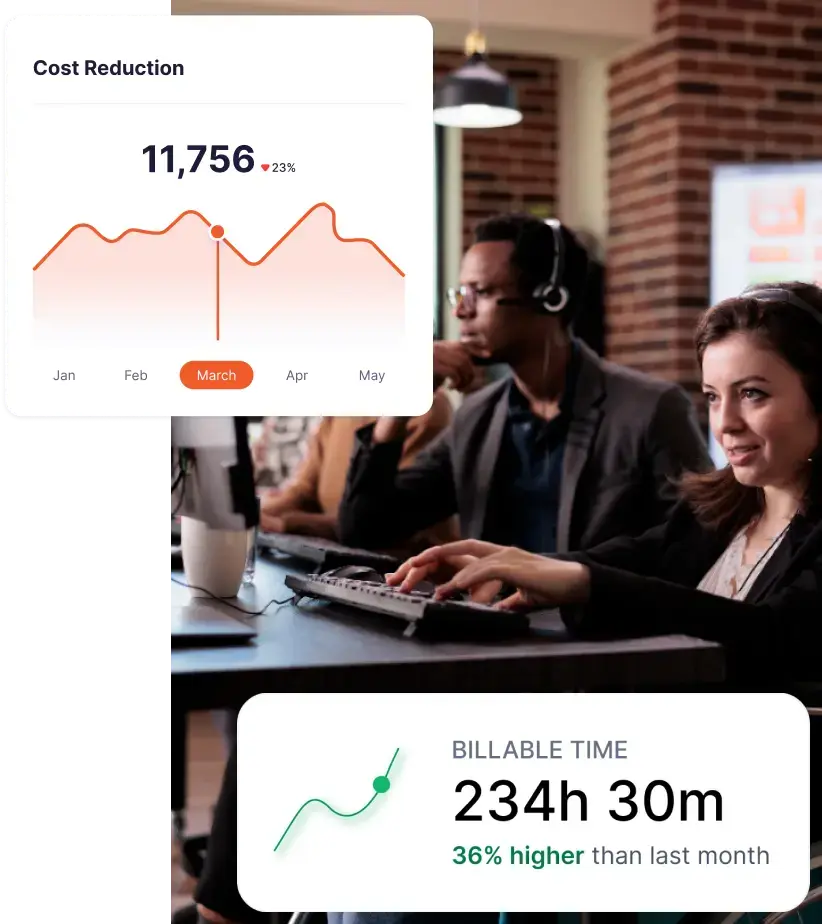
- Build defensible baselines for coaching and planning: With baseline data, you can create benchmark bands and set targets that reflect real work. Flowace’s dashboards and reports make it easy to communicate expectations and track improvements.
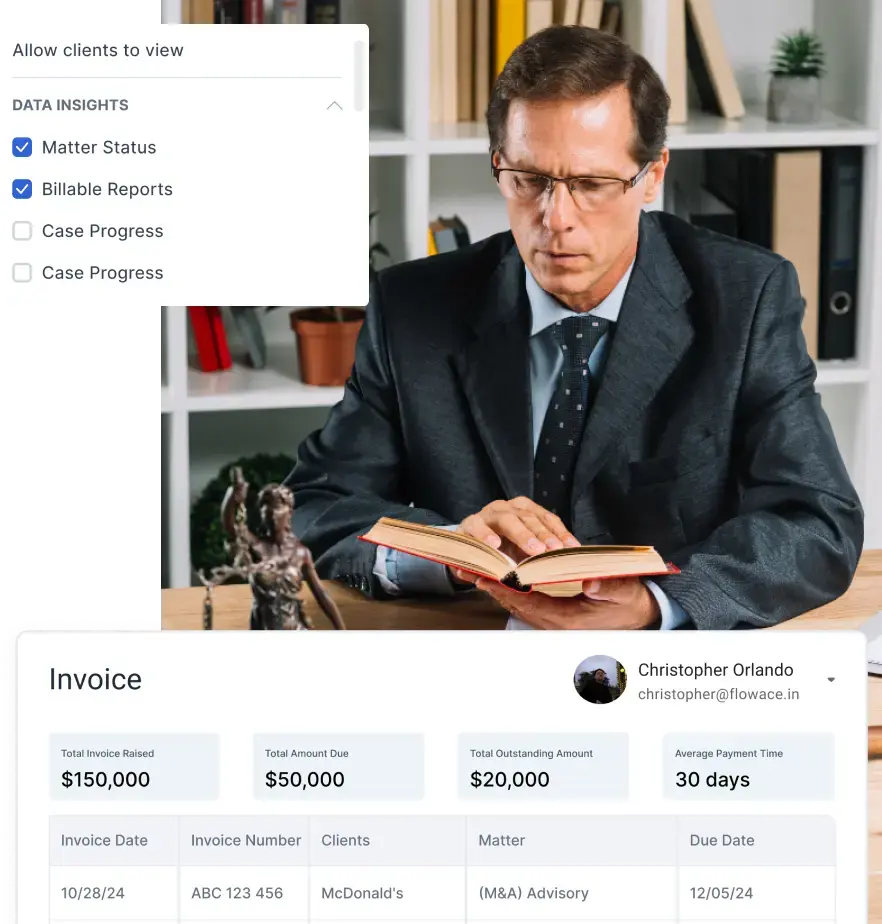
- Use productivity data for operational improvement, not surveillance: Flowace’s privacy‑first design fosters trust. Teams can anonymize or aggregate data, exclude personal apps and control data retention. The goal is to identify bottlenecks and support staff, not to micromanage.
By integrating Flowace with your revenue‑cycle systems, you can tie effort metrics to outcome metrics (e.g., time spent on eligibility checks vs. denial rate changes). This helps you understand how process changes affect outcomes and adjust benchmarks accordingly.
Final takeaway
As billing companies grapple with rising denials, shrinking margins, and increasing operational complexity, role-based productivity benchmarks are becoming a necessity rather than a nice-to-have. They give you a way to align expectations with the actual nature of the work, instead of forcing every role into the same productivity mold.
The article outlines a six-step process for establishing these benchmarks—from segmenting work by role to validating targets against quality metrics—and provides specific benchmark examples for coders, charge-entry teams, payment posters, A/R follow-up, denial management, and patient billing staff.
When benchmarks reflect role, complexity, and effort, they stop being arbitrary targets and start becoming decision-making tools.
This shift changes how you manage performance. Instead of asking, “Who is hitting numbers?” you start asking, “What kind of work is driving these numbers?”
More importantly, role-based benchmarks make performance conversations more credible. Your team understands what is expected and why. High performers are recognized for meaningful output, not just speed. And managers can coach with context instead of relying on blunt comparisons.
In a revenue cycle environment where every percentage point in denial rate or days in A/R impacts cash flow, this level of precision matters. Flowace helps medical billing teams build that visibility by automatically capturing real activity data, integrating with the tools you use and offering configurable productivity dashboards.
Move beyond blanket targets. Discover how Flowace helps you create accurate, role-based productivity benchmarks. Schedule your free demo now or start your free trial with Flowace today.
FAQs:
1. What are medical billing productivity benchmarks?
Medical billing productivity benchmarks are performance standards used to measure how efficiently billing teams complete tasks such as coding, charge entry, payment posting, and AR follow-up. They typically include metrics like claims processed, denial rates, and days in A/R.
2. Why are traditional medical billing productivity benchmarks often inaccurate?
Traditional benchmarks focus on volume-based metrics like “claims per day” and ignore complexity, effort, and rework. This leads to misleading comparisons and unfair performance evaluations.
3. What are role-based productivity benchmarks in medical billing?
Role-based productivity benchmarks are tailored performance targets specific to each billing role. They account for task complexity, effort required, and quality expectations instead of using a single standard for all roles.
4. What is the difference between outcome metrics and effort metrics in medical billing?
- Outcome metrics measure results (denial rate, days in A/R, clean claim rate).
- Effort metrics measure the work behind those results (handling time, touches per claim, rework, follow-up intensity).
Both are needed for accurate productivity measurement.
5. What are the most important medical billing productivity metrics to track?
Key metrics include:
- Denial rate
- Clean claim rate
- Days in accounts receivable (A/R)
- Net collection rate
- First-pass acceptance rate
- Active handling time
- Rework volume
- Touches per account
6. How do you set fair productivity targets in medical billing?
To set fair targets:
- Segment work by role
- Track real activity data for at least 30 days
- Adjust for complexity and experience
- Use benchmark ranges instead of fixed numbers
- Validate against quality metrics
7. What is activity-based productivity tracking in medical billing?
Activity-based productivity tracking measures how work is actually performed using real-time data like app usage, task time, and workflow patterns instead of relying on manual timesheets or estimates.
8. Why is “claims processed per day” not a reliable productivity metric?
Because it ignores:
- Claim complexity
- Rework and errors
- Time spent on documentation and follow-ups
High volume can still result in poor quality and increased denials.
9. How do role-based benchmarks improve revenue cycle performance?
They help:
- Reduce rework and denials
- Improve accuracy and first-pass acceptance
- Align workload with staff capability
- Enable better coaching and decision-making
10. What role does technology play in setting productivity benchmarks?
Technology helps capture real activity data, track effort metrics, and generate role-specific insights. This allows teams to move from guesswork to data-driven benchmark setting.