Key Takeaways:
- Denials are not just financial outcomes. They reflect how work moves through your system. If you only track denial rates and recovery, you miss the operational inefficiencies behind them.
- You need both outcome and effort metrics. Outcome KPIs show what happened, while effort metrics like time-on-task, touches, and follow-ups explain why it happened. The real insight comes from combining both.
- Visibility must exist at three levels. Outcome visibility shows performance trends, workflow visibility reveals bottlenecks, and team productivity visibility connects effort to results. You need all three to manage denial operations effectively.
- Time is your most critical signal. Metrics like time to first touch, work minutes per denial, and follow-up delays help you identify inefficiencies early, before they impact cash flow.
- SLA tracking prevents backlog and missed revenue. When you monitor SLA adherence consistently, you can catch delays, prioritise work correctly, and avoid denials aging out.
- Bottlenecks are predictable if you track the right data. Queue ageing, repeat touches, and backlog by payer or denial type help you pinpoint exactly where work is getting stuck.
- Not all denials deserve equal effort. High-performing teams prioritise based on financial impact, ensuring time is spent on high-value denials instead of low-yield work.
- Hidden work is draining productivity. Tasks like status checks, portal switching, and duplicate follow-ups consume significant time but often go unmeasured. Identifying this “hidden tax” is key to improving efficiency.
- Top teams manage workflow, not just outcomes. They focus on early action, bucket-level tracking, and real-time visibility to prevent issues rather than react to them.
- Workforce visibility tools close the gap. Platforms like Flowace help you track actual effort, enforce SLAs, and detect bottlenecks, turning denial management into a more predictable and scalable process.
In healthcare revenue cycle management, denials are usually treated like a scoreboard: how many were rejected, how many were appealed, and how much money came back. But that view misses the bigger problem. Denials are not just financial events. Every denied claim represents hours of manual effort, back-and-forth communication, and workflow friction.
To truly improve performance, you need to understand the efforts involved in the process.
That’s why denial management productivity tracking is essential. It gives you a clear view of how work happens—so you can fix inefficiencies at the source, not just react to the results.
What is denial management productivity tracking in RCM?

Traditional denial reporting focuses on outcome numbers: denial rate, appeal win rate and reimbursement dollars. These metrics are critical for financial benchmarking.
Denial management productivity tracking goes deeper by measuring the time and effort your teams spend from the moment a denial arrives until it’s resolved. It captures how quickly each denial is touched, how long it stays in a queue and how efficiently work moves through classification, follow‑up and appeal.
Instead of simply counting resolved denials, it highlights the productivity of your denial team and surfaces where process improvements will have the biggest impact.
The three layers of denial productivity visibility:
If you want a complete picture of denial management, you need to look at it in layers:
1. Outcome visibility
You track denial rates, clean-claim rates, appeal success rates, and dollars recovered. Frameworks like Healthcare Financial Management Association MAP Keys give you standardized benchmarks across patient access, pre-billing, claims, account resolution, and financial management.
These metrics tell you whether performance is going up or down. But they do not tell you why. You can see the result, not the process behind it.
2. Workflow visibility
This is where things start to get more useful. You begin to track how work actually moves through your system. That includes every step in the denial lifecycle, from receipt and classification to assignment, follow-up, appeal submission, payer response, and closure.
At this layer, you focus on flow. Where is work slowing down? Which queues are taking the longest? Are your teams meeting SLAs? You also start tracking queue ageing and the number of touches per denial.
It helps you spot bottlenecks early, before they start affecting cash flow.
3. Team productivity visibility
This layer connects your effort to results. This is where you start asking sharper questions. Are some team members consistently overloaded? Is one payer consuming a disproportionate share of effort? Is your team spending too much time on low-value denials while high-value ones wait?
You get a clear view of how work actually happens without crossing any privacy lines. That means you can balance workloads better, coach with confidence, and recognize real effort.
How should an RCM leader track denial‑management productivity?
A denial lifecycle has several stages: receipt, review, classification, assignment, follow‑up, appeal submission, payer response and closure.
Tracking each stage helps you see where time is spent and where work stalls. For instance, if denials linger unclassified or unactioned, you may need clearer routing rules. If appeals are submitted late, your team might need better SLA triggers.
Separate outcome metrics from effort metrics
Create two buckets:
Outcome metrics: These include denial resolution rate, appeal win rate, dollars recovered, average resolution time and write‑off prevention. These KPIs show financial performance.
Effort metrics: These measure team workload and process execution. They include:
- Time to first action
- Work minutes per denial
- Touches per denial
- Follow‑up delay
- Denials worked per FTE
- Rework percentage
By examining these KPI metrics together, you can see whether high denial rates stem from payer behaviour or internal inefficiency. For example, if your appeal win rate is high but resolution time is long, your team may be understaffed or misallocated.
Track productivity by denial bucket, not only by employee
Many organizations assign denials to individual billers, but productivity tracking becomes more meaningful when you also look at denial buckets. Denial buckets can be defined by payer, denial reason, clinical specialty, aging category, work queue or location.
Tracking by bucket helps you discover patterns: maybe authorisation denials from a particular payer consume two‑thirds of your time or coding denials in one specialty require twice as many touches. Bucket‑level visibility allows you to allocate work to specialists, adjust staffing and design targeted prevention strategies.
Layer SLA reporting into daily management
Service‑level agreements establish expected timelines for key denial milestones—e.g., first‑touch within one business day, follow‑up every seven days, appeal submission by day 20. SLA reporting should track the percentage of denials meeting these thresholds and highlight overdue items.
SLAs also cover escalation thresholds and queue ageing standards. When combined with time‑on‑task data, SLA reporting helps managers spot backlogs before they jeopardize appeal deadlines and cash flow.
Review quality and recovery alongside speed
Productivity isn’t only about speed. Faster work may reduce resolution time but lead to sloppy appeals or avoidable denials. Experian’s survey shows that missing or inaccurate data causes half of all denials; high‑quality resolution requires careful data validation. Track appeal success rates, rework rates, and dollars recovered to ensure that productivity gains don’t come at the expense of quality or revenue.
The core metrics that matter most in denial management productivity tracking
Not every metric adds value, and tracking too many can create noise instead of clarity. You need a focused set of indicators that show how work is executed, where time is spent, and what is slowing your team down.
Time‑on‑task metrics
- Average work time per denial — Total active time divided by number of denials. Provides a baseline for resource planning.
- Active time by denial category — Helps prioritise training and automation for high‑effort categories.
- Time spent on high‑value vs. low‑value denials — Use threshold values to classify claims with large financial impact vs. small balances. Ensure staff spend more time where recovery yield is highest.
- Time lost to non‑core work — Track minutes spent on status checks, portal logins and duplicate tasks. A high hidden tax suggests opportunities for automation.
SLA reporting metrics
- Time to first touch — Denials should be triaged quickly. Long delays signal assignment issues.
- Percentage of denials worked within SLA — Measures adherence to first‑touch and follow‑up intervals.
- Follow‑up completion within SLA — Ensures appeals are not abandoned.
- Appeal submission timeliness — Tracks whether appeals meet payer deadlines.
- Overdue queue volume — Shows how many denials have aged beyond SLA thresholds; high volume indicates bottlenecks.
Bottleneck detection metrics
- Queue ageing by denial reason — Identifies categories where work is piling up; for example, authorisation denials may age faster.
- Backlog by payer — Reveals which payers generate the largest unresolved backlog; might correlate with payer adjudication changes.
- Stalled cases by owner — Highlights individuals or teams whose queues contain many aged denials; use it for coaching and resource planning.
- Repeat touch frequency — Too many touches may signal unclear workflow or training gaps.
- Unresolved items past follow‑up date — Helps enforce accountability and triggers escalations.
Team performance metrics
- Denials worked per rep — Measures output volume.
- Recovery yield per rep — Connects effort to dollars recovered; a high yield indicates effective work.
- Productivity by shift/team — In remote or hybrid environments, compare performance across shifts and locations.
- Rework by rep or queue — High rework rate may indicate training or attention issues.
- Workload distribution — Shows whether some reps consistently handle more complex or high‑volume denial buckets.
The hidden work tax in denial management
Denial work is labour‑intensive. RCM leaders say teams are spending up to 75 hours a week on denial tasks. Much of that time goes to hidden work that doesn’t directly move a denial forward:
- Repeated status checks — Logging into payer portals to check claim status, only to find no update.
- Portal switching — Navigating multiple payer systems, each with different authentication and user interfaces.
- Duplicate follow‑ups — Multiple team members contacting the payer about the same denial because of unclear ownership.
- Manual documentation — Copying and pasting payer notes into spreadsheets or EHRs instead of using integrated tools.
- Unclear ownership — Denials sit idle because they aren’t assigned to a specific rep or bucket.
- Low‑value denials consuming the same effort as high‑value ones — Without ranking denials by financial impact, staff may spend as much time on a $30 denial as on a $3,000 one.
With this data, managers can rebalance work, refine processes, automate status checks and coach teams on high‑impact work.
What high‑performing denial teams do differently
High‑performing teams categorise denials by payer, denial reason or specialty and route work to the people best equipped to handle each bucket. This targeted approach reduces touches per denial and improves resolution quality. Bucket‑level reporting also clarifies which denial types consume the most time and which deliver the highest recovery yield.
They treat time to first action as a leading indicator
Rather than focusing solely on final resolution time, top teams track how quickly a denial is first touched. Slow first‑touch times signal staffing imbalances, unclear assignment or front‑end issues. Addressing delays early prevents backlogs and missed appeal windows.
They balance speed, quality and recovery value
Busy teams can still have low recovery yield if they spend time on low‑value denials. High‑performing teams prioritise denials based on potential reimbursement and track both recovery dollars and rework rates. They recognise that speed alone is meaningless if it leads to more errors or appeals with little financial impact.
They use real‑time workflow visibility to coach teams
Denials aren’t just a billing issue; they reflect payer behaviour, front‑end errors and back‑office execution. High‑performing teams use real‑time dashboards to track time‑on‑task, SLA adherence and queue ageing. This data allows managers to coach individuals based on evidence, not anecdotes, and to adjust staffing proactively when workloads shift.
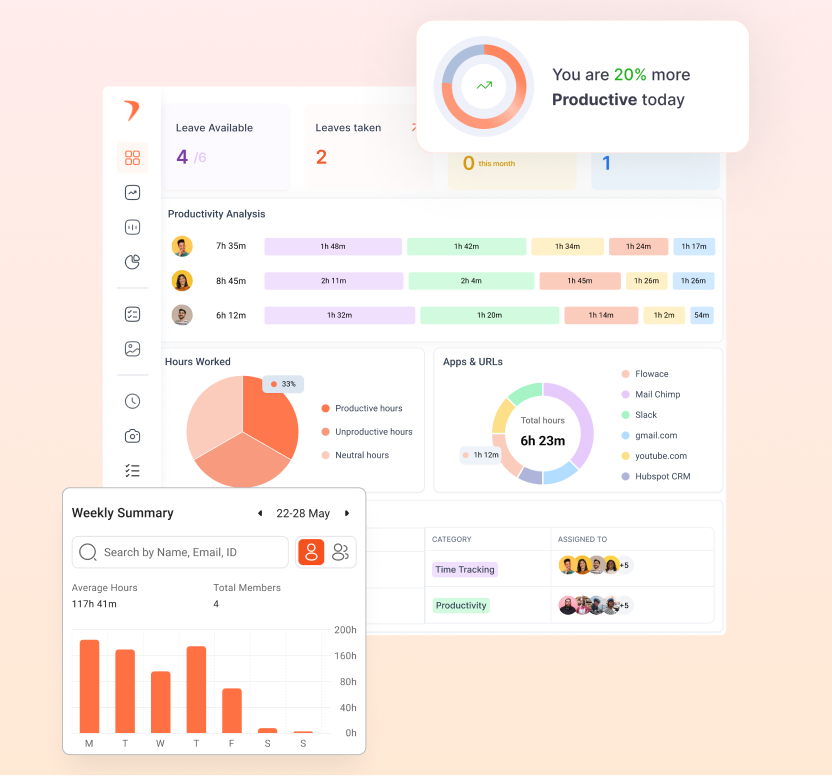
How Flowace helps RCM leaders improve denial productivity visibility
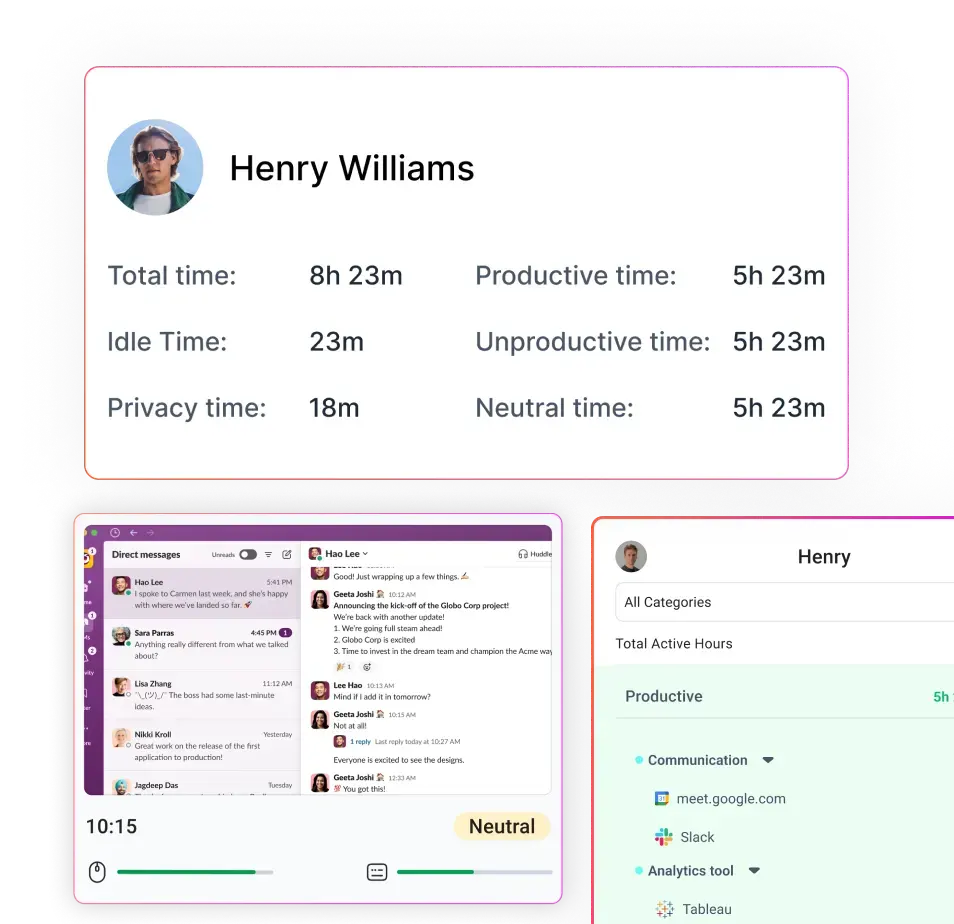
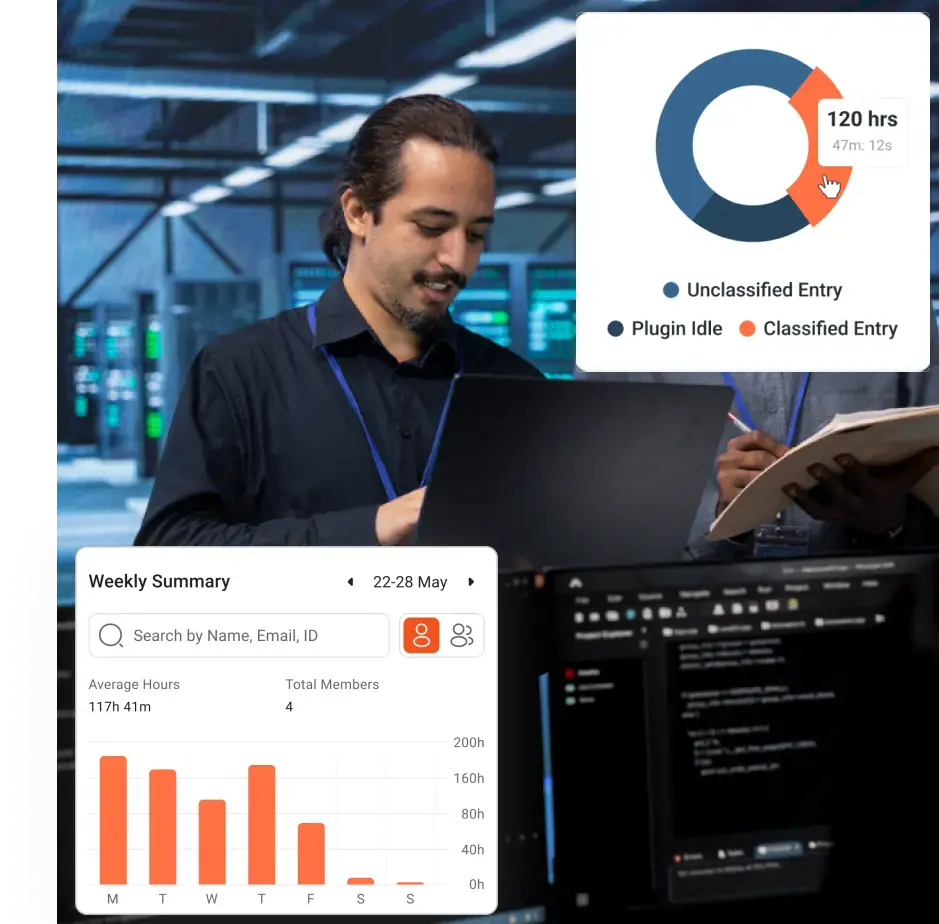
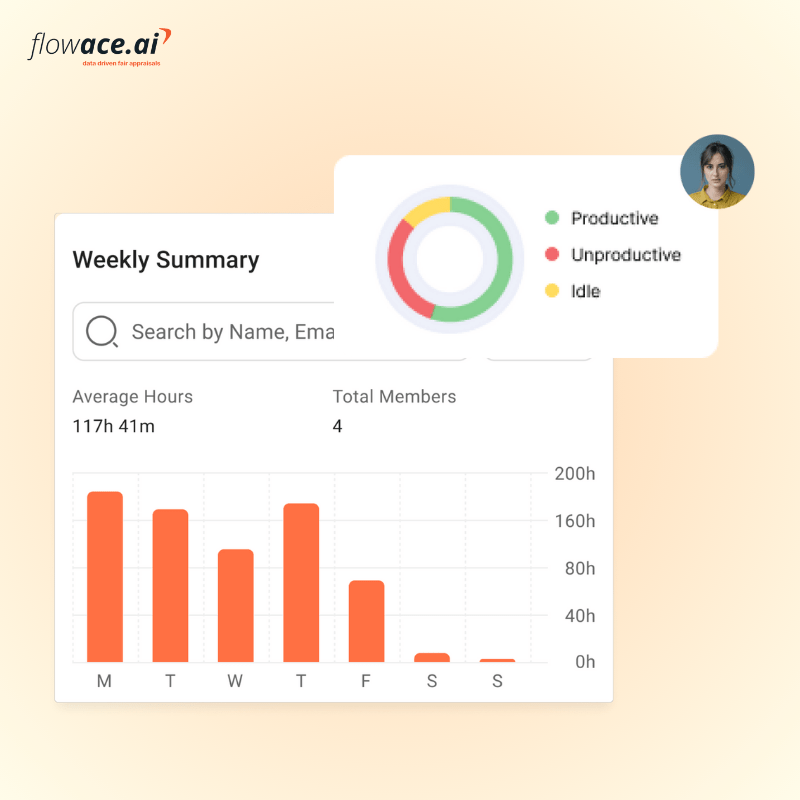
Flowace is not a denial‑management platform per se. It is a hands‑free time‑tracking and productivity monitoring solution designed for remote, hybrid and in‑office teams. By automatically capturing time‑on‑task, app and website usage, idle time and productivity patterns, Flowace gives RCM leaders the workforce visibility layer needed to manage denial productivity. Here’s how it helps:
From black‑box denial work to visible team execution
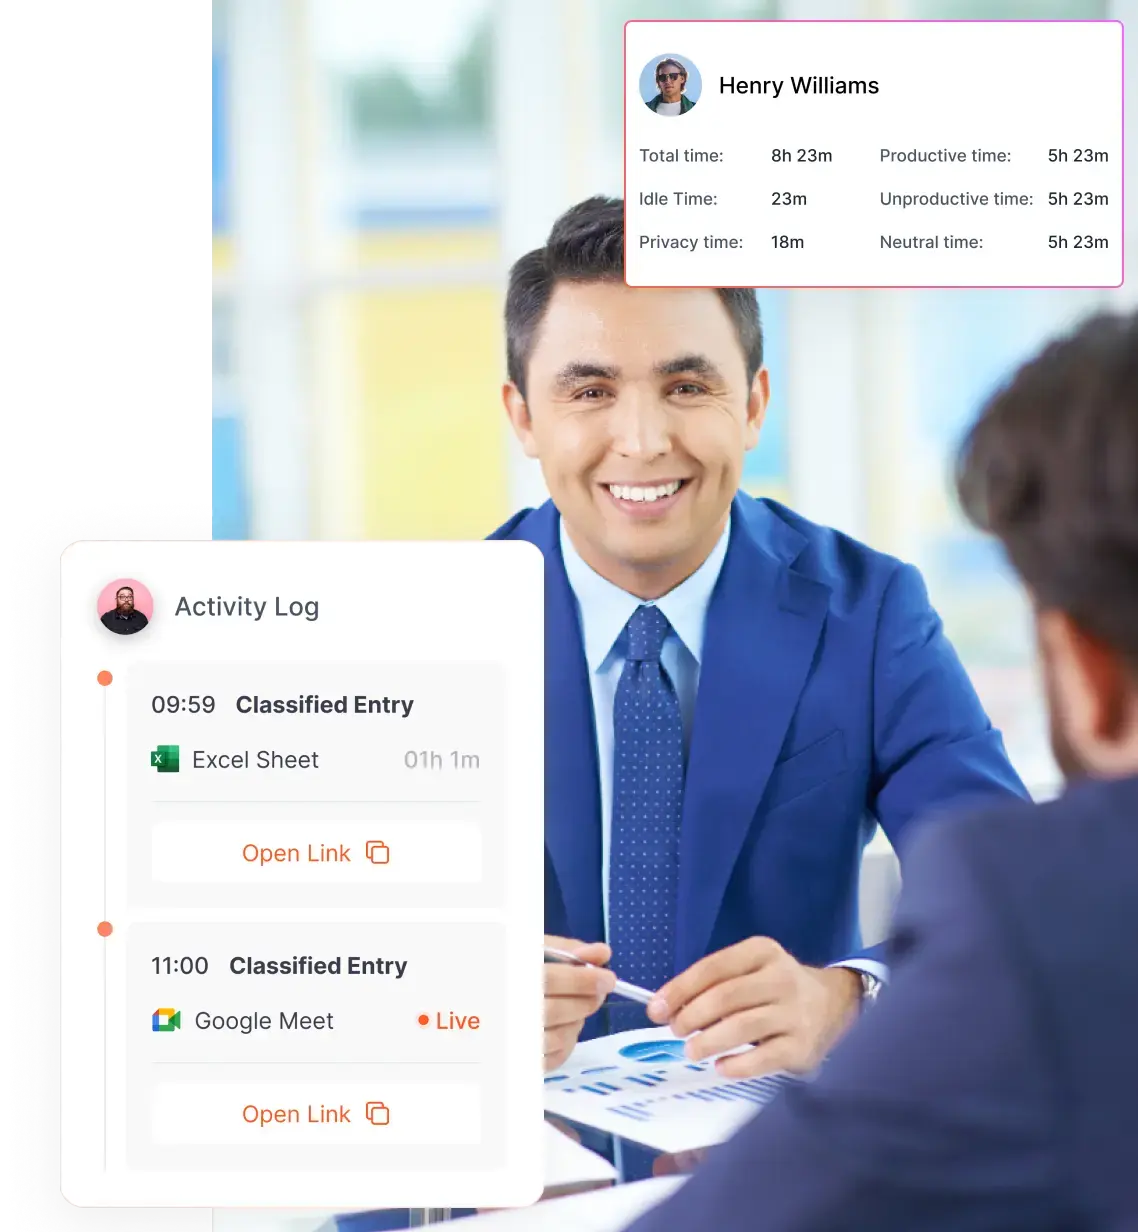
Flowace records the actual time employees spend on tasks across applications. This means RCM leaders can see how many minutes each denial analyst spends on claim classification, portal navigation, appeal letter drafting and follow‑up. Instead of relying on self‑reported timesheets, you get objective, second‑by‑second data. Visibility into time spent and activity patterns turns denial work from a black box into a transparent workflow. If your team is spending too much time on low‑value denials or stuck in payer portals, Flowace shows it.
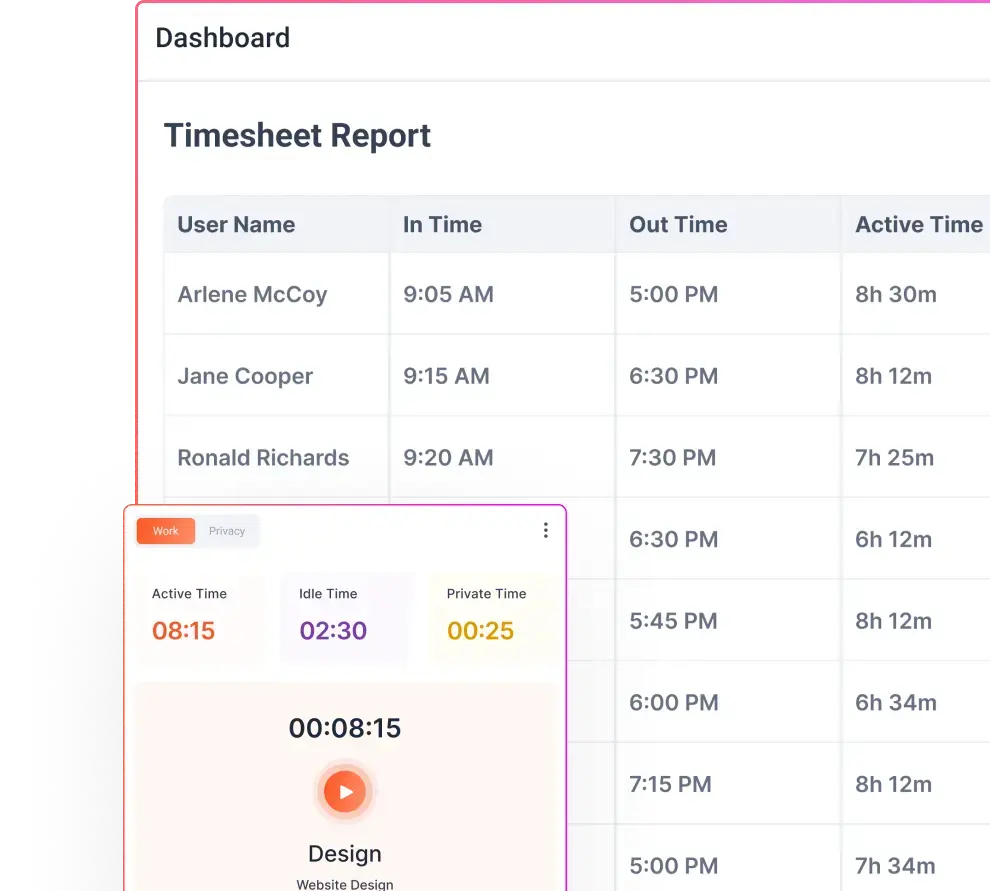
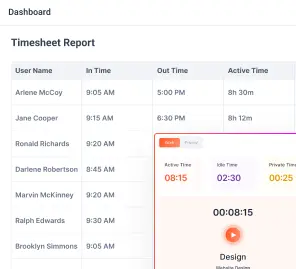
Track time‑on‑task without relying on manual reporting
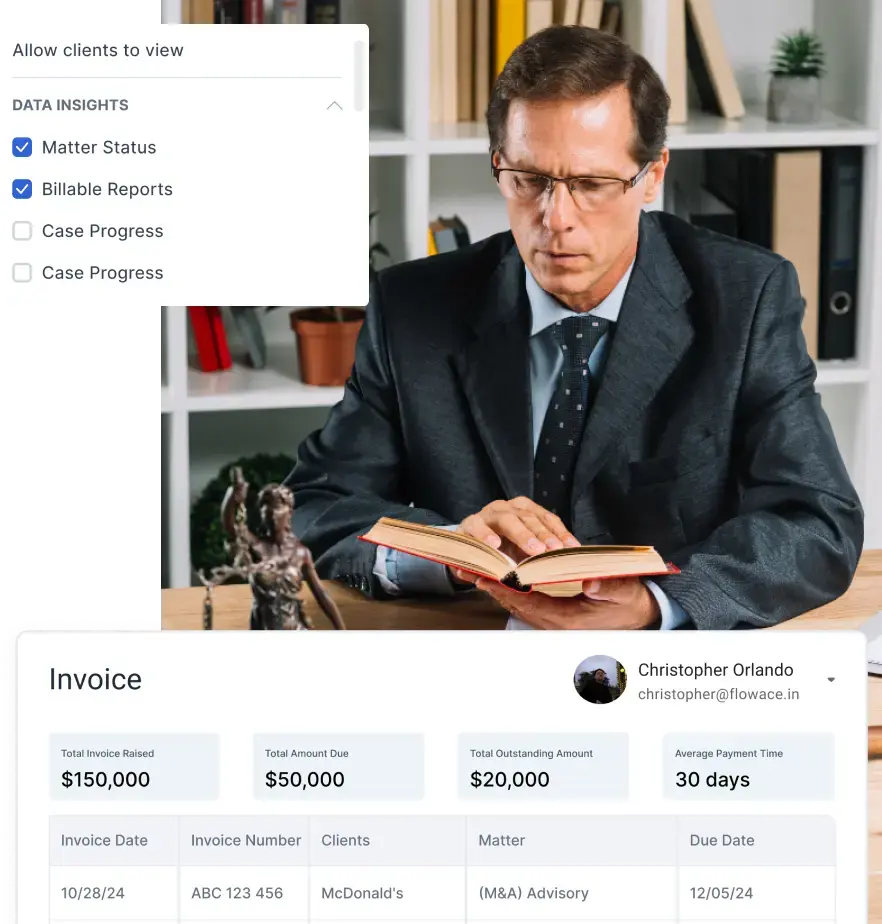
Manual time entries are prone to errors and omissions. Flowace’s automatic time tracking with screenshot verification and silent monitoring features removes manual overhead. Its Standard and Premium plans offer app and website tracking, configurable productivity ratings, raw activity logs and internet connectivity reports. The Premium plan includes keyboard and mouse activity monitoring (endpoint monitoring), billing and invoicing integrations and single sign‑on support. These features allow RCM leaders to track time‑on‑task across denial activities and ensure that productivity data is accurate.
Strengthen SLA reporting across denial workflows
By combining time‑on‑task data with custom alerts, Flowace can notify managers when SLAs are at risk. For example, if a denial hasn’t been touched within the first day, or if a follow‑up is overdue, managers receive a prompt. Configurable productivity dashboards and reports help supervisors monitor team performance and identify where SLA adherence is slipping. Because Flowace captures both online and offline time, you can account for work done in payer portals or manual documentation without gaps.
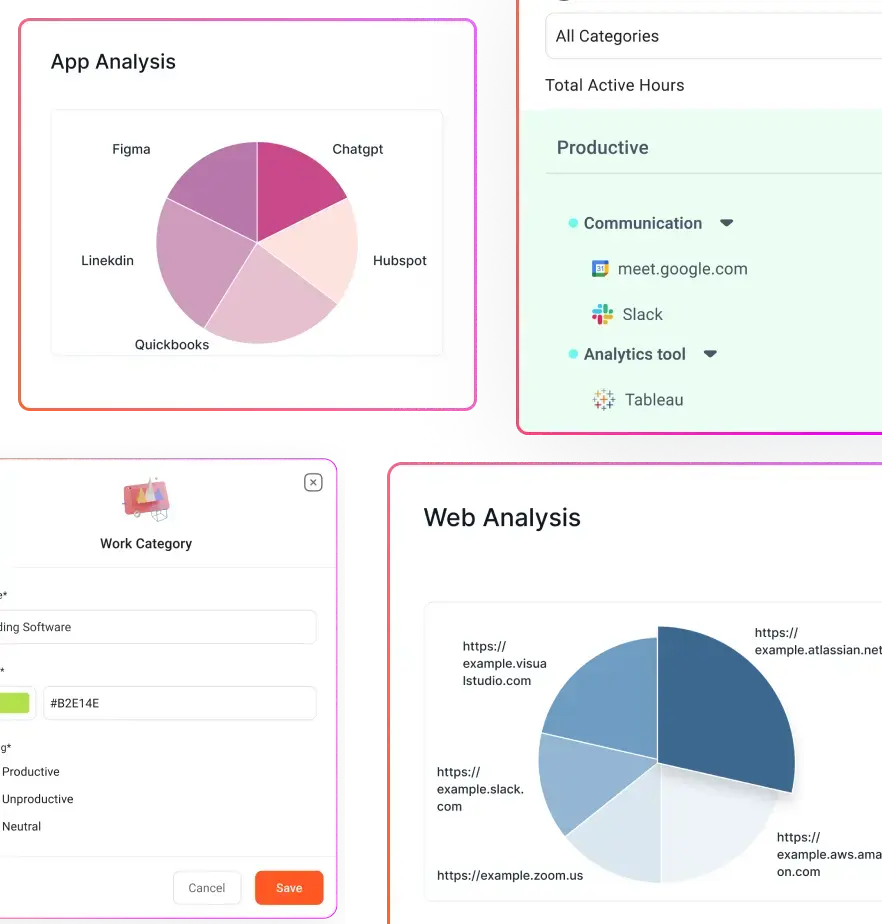
Detect bottlenecks before recovery performance suffers
Flowace’s dashboards aggregate time data by project, task or category. RCM leaders can create denial‑management categories, such as authorisation appeals, medical‑necessity denials or coding corrections, and see which categories consume the most time. If one queue shows significant ageing, managers can reassign work or provide additional training before denials slip past filing deadlines. By detecting bottlenecks early, organizations reduce rework and improve recovery performance.
Improve denial team accountability without creating micromanagement
Transparency can be sensitive in healthcare operations. Flowace emphasises accountable productivity rather than surveillance. Its features, like silent app tracking and one‑second precision activity logs, provide objective data while respecting user privacy and focusing on outcomes. Managers can set custom idle‑time thresholds to avoid over‑monitoring and can use aggregated reports to coach teams rather than policing individuals. This balance is essential in healthcare environments where staff morale and trust are critical.
What to look for in a denial productivity tracking solution
When evaluating tools to improve denial‑team productivity, consider the following capabilities:
Operational visibility, not just summary dashboards
Look for tools that show granular workflow data—time spent per task, queue ageing and follow‑up cadence—rather than only high‑level summaries. High‑performing teams need to drill down into the details behind metrics.
Time‑on‑task and workload transparency
Automated time tracking and activity monitoring should accurately capture work hours without manual entry. This transparency is critical for balancing workloads and identifying hidden work.
SLA reporting and queue monitoring
The system should allow custom SLA definitions and provide alerts when denials are overdue. Queue monitoring features should highlight where work is stalling.
Team‑level and manager‑level reporting
Reports should be available by individual, team, shift and denial bucket. Managers need to see performance trends across time to coach effectively.
Easy adoption for remote, hybrid or distributed RCM teams
Cloud‑based solutions with minimal IT overhead and single sign‑on support facilitate adoption. For example, Flowace offers remote‑friendly deployment and a free seven‑day trial with tiered pricing for Starter, Standard and Premium plans starting around ₹166 (about $2) to ₹835 (about $10) per user per month
Actionable insights for coaching, staffing and workflow design
Insights should go beyond dashboards to recommend staffing adjustments, identify training needs and suggest process changes. Tools powered by AI and analytics can help teams reallocate work and focus on high‑value denials.
Final takeaway
Denial management productivity tracking is not about measuring busyness. It’s about understanding how time, workload, and workflow discipline affect denial recovery.
By tracking time‑on‑task, SLA adherence, queue ageing, and team performance, RCM leaders can turn denial management from a black box into a transparent, coachable workflow. Flowace provides a workforce‑visibility layer that captures the effort behind denials, enabling organizations to improve recovery without adding chaos or headcount.
The next generation of denial management isn’t just about arguing with payers—it’s about working smarter and eliminating preventable denials before they happen.
If you want to see what your denial workflows really look like beneath the surface, book a free demo or start your free trial to see how Flowace helps you turn denial management into a more predictable, efficient, and data-driven operation.
FAQs:
What causes bottlenecks in denial workflows?
Bottlenecks often occur during intake and classification, when denials aren’t routed promptly; during follow‑up, when callbacks or payer checks are missed; during appeal preparation, when documentation is incomplete; and at the manager level, when lack of visibility prevents timely intervention.
How does SLA reporting improve denial management performance?
SLAs define expected timelines for first touch, follow‑up and appeal submission. Tracking SLA adherence highlights overdue denials and forces teams to prioritise work appropriately. When combined with time‑on‑task data, SLA reporting helps managers rebalance workloads and prevent missed deadlines.
Why are denial KPIs alone not enough?
Denial KPIs show what happened, but not why. Teams can look productive on paper while still underperforming if they spend too much time on low‑value tasks, experience hidden bottlenecks or rework denials repeatedly. Effort metrics reveal these issues and help managers intervene.
How can RCM leaders track time‑on‑task for denial teams?
Automated time‑tracking tools like Flowace capture time spent on tasks without manual input. They record app and website usage, idle time and activity patterns to provide accurate, granular data on how long employees spend on different denial activities.
What is denial management productivity tracking?
Denial management productivity tracking goes beyond counting denials resolved. It measures how quickly and efficiently denial teams move work, capturing time‑on‑task, SLA adherence, queue movement and bottlenecks. This visibility helps RCM leaders connect team effort to recovery outcomes.
Which KPIs matter most for denial management teams?
Both outcome and effort metrics matter. Outcome metrics include denial rate, appeal win rate, dollars recovered and average resolution time. Effort metrics include time to first touch, touches per denial, work minutes per denial, follow‑up delay and rework rate. Combining these metrics provides a complete picture of performance.