Key Takeaways
- Start with evidence, not targets: Build productivity baselines for remote and hybrid teams using a 30-day observation period. Collect real work signals before defining employee productivity benchmarks.
- Logged hours are not productivity: Login time and active time can mislead. Focus on productive time, meeting load, utilization, and context to avoid rewarding presence over progress.
- Use distributions, not averages: Medians and 75th percentiles create fair, role-specific productivity standards. Averages inflate expectations and distort benchmarks.
- Analyze patterns at the role and team level first: Diagnose structural issues such as meeting overload, context switching, and uneven workload before evaluating individuals.
- Separate focus work from coordination work: Deep work capacity and meeting load must be measured independently to set realistic productivity metrics for distributed teams.
- Treat the first 30 days as a learning phase: No alerts, no warnings, no leaderboards. The goal is understanding workflow patterns, not grading performance.
- Clean and classify your data carefully: App categorization, idle exclusions for meetings, and proper logging of offline work are critical to building defensible baselines.
- Publish role-based ranges, not rigid quotas: Sustainable productivity benchmark ranges reflect variance across roles and reduce the risk of micromanagement.
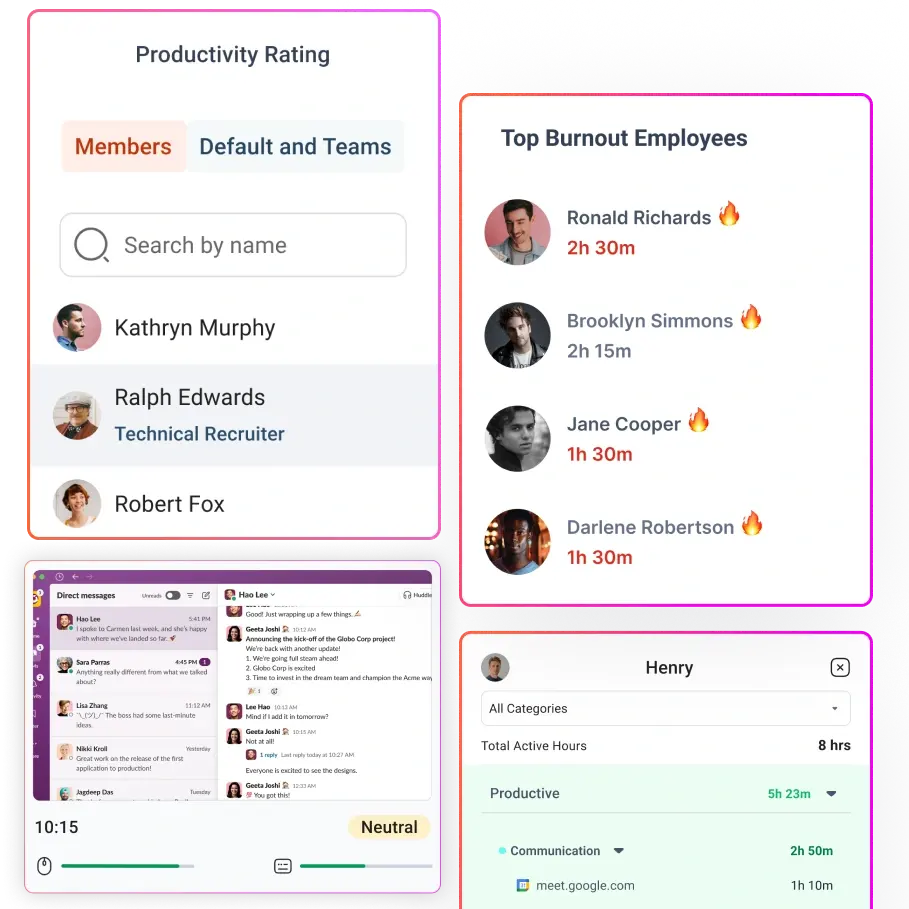
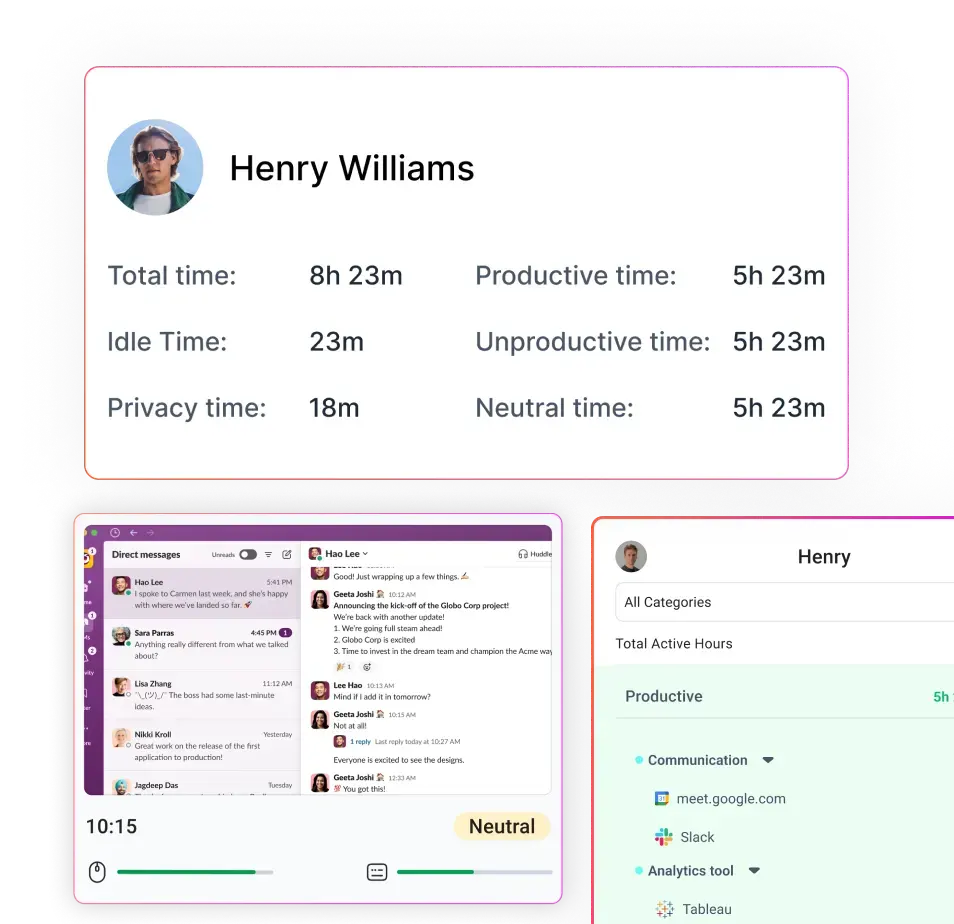
- Combine outcome and activity metrics: Use productive time percentage, meeting load, utilization rate, timesheet accuracy, attendance consistency, and burnout hours together for a balanced view.
- Make privacy and governance explicit: Monitoring must be necessary, proportionate, and transparent. Define who can see what, how long data is retained, what is excluded, and how disputes are handled.
- Give employees visibility into their own data: When people can see their trends, they self-correct. Transparency builds trust and reduces fear of hidden evaluation.
- Iterate continuously: Productivity baselines are living standards. Revisit them as workflows, tools, and team structures evolve.
Most attempts to measure remote work fail because they start with targets instead of evidence. This 30-day approach flips that script. This framework helps you spend one month collecting real signals about how people actually spend their time, then use those signals to define fair, role-specific baselines you can plan and coach your team around.
The resulting productivity baselines for remote and hybrid teams feel fair, transparent, and useful because they are grounded in evidence.
What a Productivity Baseline Is and Why Teams Get It Wrong?

A productivity baseline is the typical amount of focused, work-related time you see for a role or team over a defined period, after excluding idle time and non-work activity. It defines the normal performance range you can rely on for employee productivity benchmarks and setting productivity standards.
Most teams get productivity baselines wrong because they use the easiest number, not the right one: logged hours.
But logged hours only shows that the device was in use, not that focused, valuable work took place.
Relying on logged time produces three predictable problems: it creates false confidence (hours ≠ impact), it rewards presence over progress, and it pushes managers toward blunt targets that encourage busywork. Worse, it can hide real issues like fragmented schedules, excessive context switching, or an overload of shallow meetings.
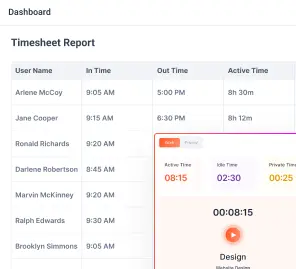
Logged hours vs active vs productive hours: A Quick Comparison
| Metric | What it shows | Why can it mislead |
| Login time | Device open duration | Includes breaks, waiting, meetings, and “always-on” behavior |
| Active time | Keyboard + mouse activity | Includes distractions and busywork |
| Productive time | Time in work-related apps/tasks | Depends on how you classify apps, roles, and offline work |
A better approach is to mix the signals and timestamps. Combine activity traces with outcomes and context: blocks of uninterrupted deep work, meeting load, task completion rates, and short qualitative check-ins. Use those signals to build role-specific, evidence-based standards rather than one-size-fits-all quotas.
Why Day-One Benchmarks Backfire and How to Set Guardrails?
If you set employee productivity benchmarks on day one, you will almost always get pushback. Early numbers often seem random and carry unnecessary weight. You also risk punishing the wrong people. In modern work, high-value time often looks quiet with reading, thinking, reviewing, learning, or listening in meetings. That may appear “inactive” on the surface. Yet that quiet time is often where the real value is created.
At the same time, the structure of today’s work makes measurement even trickier. Research from Microsoft shows that many employees are interrupted roughly every two minutes by meetings, emails, or notifications. When work is this fragmented, productivity becomes choppy. If you measure only visible activity, you capture motion instead of momentum.
To avoid this trap, you need a simple guardrail policy:
- First, treat the baseline month as a learning period, not a disciplinary one. The goal is to understand how work actually flows across roles and teams before you attach consequences to any metric.
- Look at patterns at the role and team level before you zoom in on individuals. When you start broadly, you see structural issues such as meeting overload, uneven workload, or fragmented schedules. Only after you understand the system should you examine true outliers. Even then, with context.
- Draw firm boundaries around privacy. You should not use monitoring to capture private life or off-hours behavior by default. Data collection must have a clear business purpose. If you use employee monitoring data collection for performance review, define that purpose explicitly and limit the data strictly to what is necessary and proportionate.
The 30-Day Framework to Set Productivity Baselines
You can run this as an operational 30-day sprint to build role-specific, evidence-based employee productivity benchmarks without defaulting to micromanagement. It is built to support remote workforce analytics, monitor productivity across hybrid teams, and measure performance metrics for distributed work environments.
Week 1 — Observation: learn, do not judge
Goal: You start by watching how work actually unfolds, not by grading people. The aim is to collect a clear, unbiased view of daily patterns so you can make decisions from evidence rather than a hunch.
What you track:
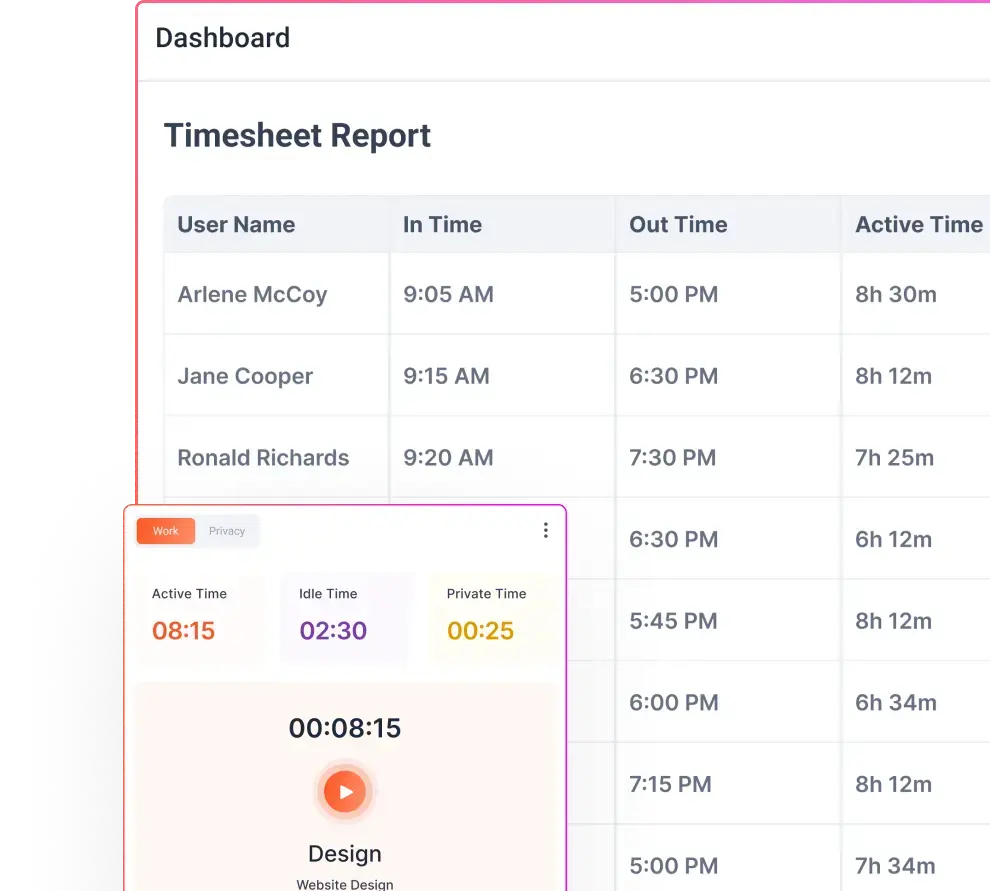
- Login and logout patterns to check attendance consistency
- Ratio of active time to idle time so you can see where focus is available
- Meeting hours per person and by role to understand collaboration load
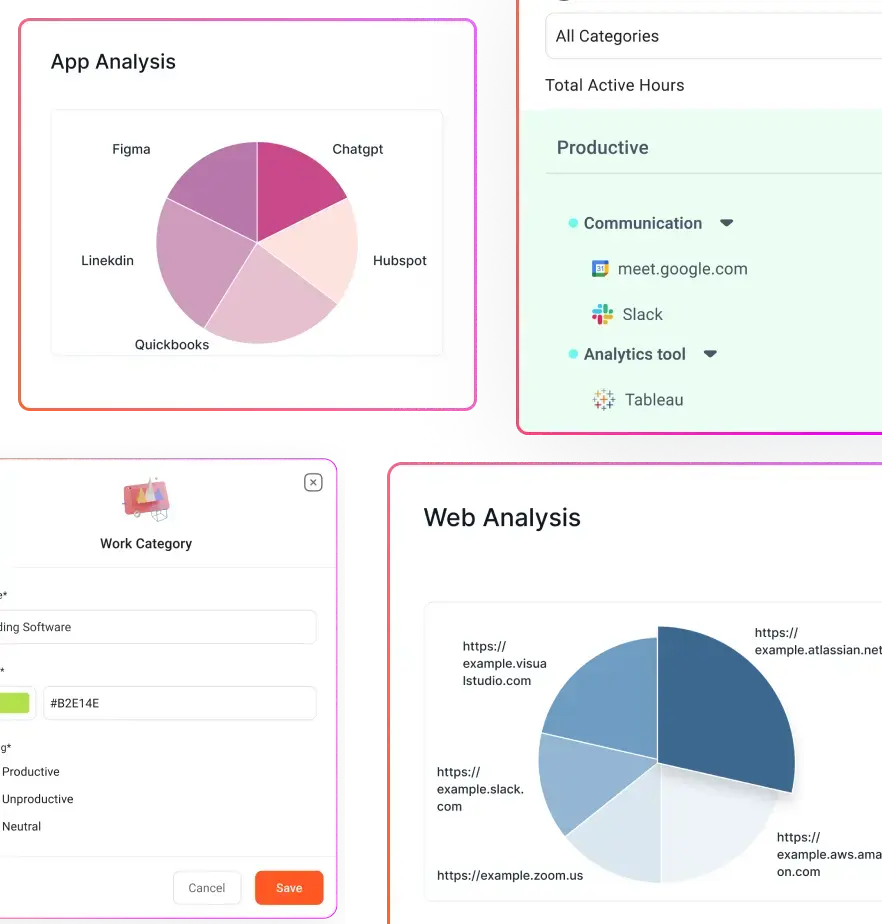
- App and website usage categories to spot where attention goes during the day
- Manual or offline work entries such as client calls, workshops, and whiteboarding
Hard rule for this month: No alerts, no warning messages, and no leaderboards. Treat this period as a fact-finding mission, not a performance window.
Kickoff message you can copy and paste:
We are running a 30-day baseline to understand how work flows across roles. This is not a performance rating period. We will share what we learn and decide together what benchmarks make sense. You will be able to see what we see.
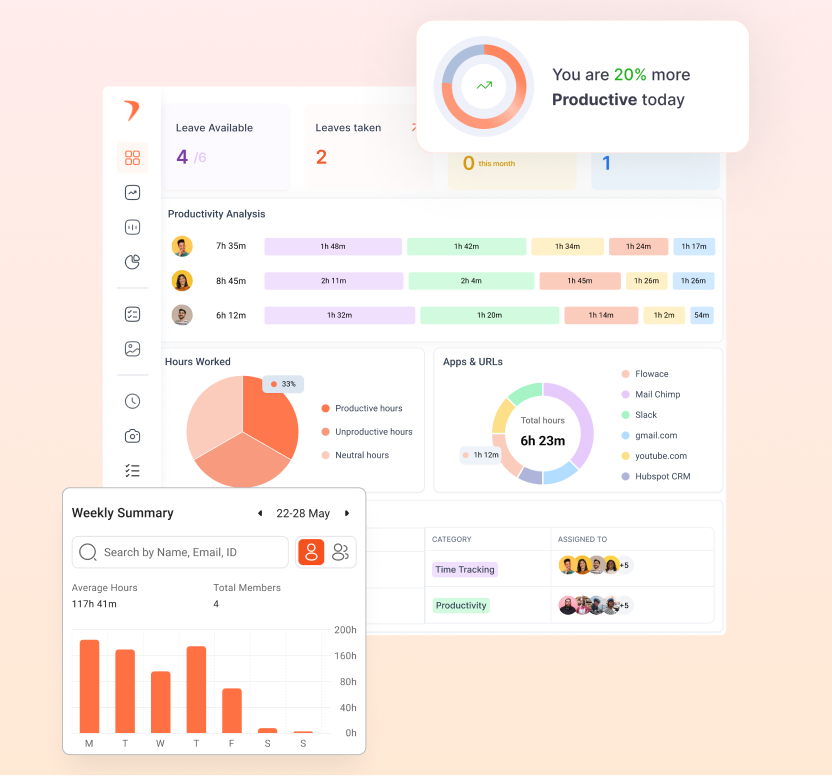
Why automate data collection:
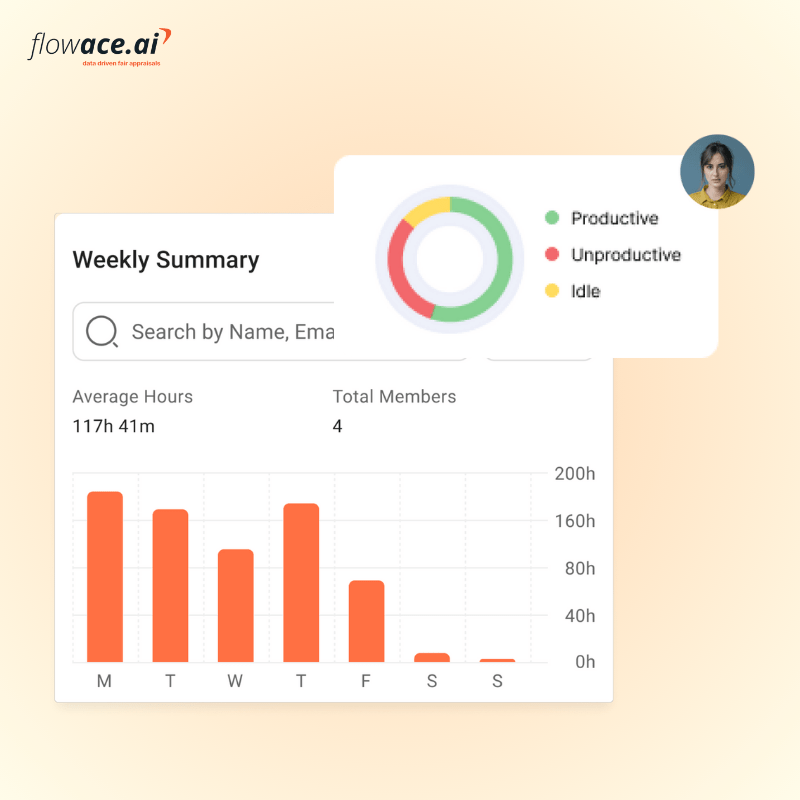
Automated, AI-assisted tracking reduces the burden of manual timesheets and gives you cleaner signals to analyze. It surfaces useful patterns like idle blocks, missing hours, and early warning signs of overload so you can focus on diagnosing workflow problems instead of wrestling with spreadsheets. Tools such as Flowace can help by collecting and visualizing those patterns for the team.
Week 2 — Categorization and data cleaning: make the data mean something
Goal: Ensure your signals represent real work. Clean the data so you can distinguish true productive time from artifacts like passive meetings, system lag, or brief idle moments.
Things to watch for:
- Track idle time carefully. Idle does not always mean unproductive. Time spent on calls, training, reading, or listening often shows as low keyboard activity but still delivers value.
- Excluding meeting tools from idle detection prevents false negatives. Configure these exclusions at the team or role level so a long webinar does not register as lost time.
- Watch for tooling artifacts. Auto-syncs, background uploads, or screen sharing can create misleading activity spikes or drops.
- Pay attention to offline work. Client calls, whiteboarding sessions, and workshops are real work even when they happen away from the keyboard.
What to do, step by step:
- Label apps at the team or role level as productive, neutral, or unproductive. Start with obvious cases and refine with input from each team.
- Create an exclude-idle list for meeting and passive-work tools so those sessions are treated as engaged time.
- Decide how you will capture offline and manual work. Agree a simple logging method for client calls, workshops, and field work.
- Document your classifications and the rationale so everyone understands why a tool sits in a given bucket.
- Start small and iterate. Run one classification pass, review odd cases with team leads, then adjust and repeat.
App classification worksheet:
Before you can trust your baseline data, you need a shared view of what different tools represent. Not all screen time carries the same weight. Some tools drive direct output, some enable coordination, and others simply support research. A simple classification worksheet helps you separate signal from noise and prevents you from mislabeling legitimate work as distraction.
This process becomes significantly easier if you replace multiple tools with one unified system that standardizes tracking and classification logic.
Here is how to think about each category:
- Core productive tools (role specific): for example, IDEs for developers, design apps for product designers.
- Coordination tools: email, chat, calendar. These are often necessary but distinct from deep focus work.
- Neutral research tools: documentation sites, reference databases, internal wikis.
- Clearly unproductive tools (use cautiously): sites or apps that consistently distract, but validate before flagging them.
Keep the process collaborative and transparent. When people help classify tools and validate edge cases, your cleaned dataset will reflect real work and your baselines will be far more defensible.
Week 3 — Pattern analysis: move from single days to distributions
Goal: Identify role-based patterns and meaningful variance. By week three, you should stop looking at isolated days and start looking at distributions. A single high or low day tells you very little. What matters is the pattern that repeats across the role.
How to analyze:
- Use percentiles, not averages. Rely on the median and 75th percentile to define normal and strong performance. Averages get distorted by short-term spikes.
- Illustration: If most people log 4.5 to 6 productive hours but a few log 9 to 10 during a crunch week, the average inflates the benchmark. The median, on the other hand, shows you the true center of the distribution. The 75th percentile shows you what strong but sustainable performance looks like.
- Separate focus work from coordination work. You want to see how much deep work capacity actually exists versus how much time is consumed by meetings, email, and chat. If you lump everything together, you hide the structural drag that coordination creates.
- Include a meeting-adjusted view. Meeting load is not a side detail. It directly affects available focus time. If one role spends four hours a day in meetings and another spends one, their productive time bands should not be compared without context.
A simple role-based baseline formula you can use:
Actual Work Baseline = (Average productive time per day for role × working days in period) ÷ total available work hours
What you are looking for:
- High variance roles that require wider acceptable bands rather than tight thresholds.
- Chronic overtime clusters suggest burnout risk rather than high performance.
- Tool-driven distraction trends where time in clearly unproductive apps gradually increases.
- Phantom idle patterns that are actually driven by meetings, research-heavy tasks, or slow systems rather than disengagement.
At this stage, you are not judging individuals. You are diagnosing systems. The patterns you uncover here determine whether your eventual benchmarks will be fair, realistic, and defensible.
Week 4 — Benchmark setting and communication: set standards people accept
Goal: In week 4, you can publish clear, fair ranges and a governance process that the team can use continuously.
Rollout steps:
- Share findings with teams first. Present patterns and trends, not individual callouts.
- Be explicit about what you measure and what you do not measure. Make those boundaries visible.
- Publish role-based ranges for productive time and utilization instead of single-point quotas. Provide context so people understand how to interpret the ranges.
- Decide on alerting only after baselines exist and the team has accepted them. Possible alerts include missing hours, repeated late starts, or early burnout signals, but introduce alerts only after agreement on baselines.
- Commit to a 60-day review cadence and schedule the first revision now.
Why transparency matters:
Pew’s research on AI in worker evaluation is blunt: large majorities expect employees to feel like “Big Brother is watching” if AI is used to monitor and evaluate workers. That is why your rollout must be explicit about purpose, limits, and employee access to their own data.
After day 30 — keep the policy practical and privacy-friendly
- Treat baselines as living artifacts and revisit them after process, tooling, or role changes.
- Use team-level patterns as your primary guide and only investigate individuals when patterns persist after contextual review.
- Respect privacy guardrails and follow regulator expectations for necessary, proportionate, and transparent monitoring, as reflected in guidance like that from Microsoft and relevant privacy authorities.
Quick checklist for launch
If you want this rollout to land well, move through it in a clean sequence and keep the logic tight:
- Send the week 1 kickoff message
- Configure minimum tracking set and exclude idle for meeting tools
- Run week 2 app classification and clean the data
- Compute medians and 75th percentiles for each role in week 3
- Present team-level findings and publish ranges in week 4
- Agree on review cadence and privacy guardrails
Run this plan, iterate fast, and you will get employee productivity benchmarks and set productivity standards that your teams trust and that actually reflect how work gets done.
Which Productivity Metrics to Use for Distributed Teams?
Your baseline should combine outcomes and activity signals. That keeps you honest and forms the foundation of a simple employee productivity scorecard. Outcome-only can hide capacity issues. Activity-only can turn into surveillance theater.
Use these terms consistently across productivity metrics for distributed teams:
- Productive time %: Productive hours / total tracked hours.
- Active vs idle ratio: Active hours compared to idle hours.
- Meeting load: Meeting hours / total hours. Track separately.
- Utilization rate (core workforce utilization metrics): billable hours / available hours for billable roles.
- Timesheet accuracy: % of hours categorized to project/task correctly (helps billing).
- Attendance consistency: start time adherence and missing hours trends.
- Burnout hours: time beyond expected hours, tracked as a health signal.
Starter Benchmark Ranges:
| Metric | Starting range | What it prevents |
| Productive time % | 55% to 75% (role-dependent) | Unrealistic “all day focus” expectations |
| Idle time | Under 20% (after meeting exclusions) | Mislabeling meetings and passive work |
| Burnout hours | Under 5% above expected hours | Normalizing overtime |
| Attendance compliance | Over 90% | Chronic late starts and missing hours |
Treat these as scaffolding. Your real goal is to replace them with your own baseline distributions.
How to Prevent Productivity Baselines From Turning Into Micromanagement?
This is where most advice falls apart. Plenty of tools will tell you what to track. Very few explain how to protect trust while you do it.
If you want this to work long term, you need to design the program around employee privacy and productivity from day one.
A privacy-first program has four non-negotiables:
Be Transparent And Proportionate
Monitoring has to be necessary and proportionate. Workers should clearly understand the nature, extent, and purpose of monitoring.
This is not only about compliance. It is about culture. If people cannot explain in plain language why something is being measured, the default assumption becomes suspicion. You prevent that by stating what you track, why you track it, and what decisions it will and will not influence.
Default To The Least Intrusive Signals
Avoid making always-on surveillance your starting point. A trust-first model works better. Establish baselines before setting targets so you do not accidentally create unrealistic expectations or encourage metric gaming.
Use alerts as exception handling, not as a constant supervision layer. Alerts should surface meaningful deviations after a baseline exists, not generate noise from normal variation.
Give Employees Access To Their Own Data
When people can see their own trends, most of the heavy lifting happens automatically. They self-correct. You also remove the fear of hidden evaluation.
Flowace includes concepts like Privacy Mode and configurable alerting (missing hours, burnout hours, inactivity alerts), which can support a “coach, not police” approach if you choose the right defaults.
Build A Governance Layer
You need written, explicit answers to a few core questions:
- Who can see what, using role based access
- How long data is retained
- What is excluded, including personal time and sensitive categories
- How disputes or corrections are handled
In some U.S. states, including Connecticut, there are explicit notice requirements around electronic monitoring. Even if you are not operating there, it is a sound operational practice to document your approach, notify employees, and secure acknowledgment.
Final Thoughts
If you want productivity baselines that actually work for remote and hybrid teams, you have to earn them.
A 30-day, evidence-first approach gives you something most organizations never achieve: productivity benchmarks grounded in real workflow data, not assumptions. Instead of guessing how long focused work “should” take, you build role-specific productivity standards from observed patterns. Instead of defaulting to rigid quotas, you define sustainable ranges that reflect meeting load, coordination overhead, and deep work capacity.
That is the difference between surveillance and strategy.
Most importantly, you shift the conversation from hours to outcomes, from presence to progress, and from control to clarity.
If you apply this 30-day framework with discipline, you will set employee productivity benchmarks that are fair, data-driven, and adaptable as your workflows evolve.
And if you want to see your real work patterns over a month without wrestling with spreadsheets, start a free trial or book a demo with Flowace and evaluate the data for yourself.
FAQs:
1. How long does it take to set productivity baselines for remote teams?
About 30 days is ideal because you capture normal variance across weeks, meetings, and project cycles.
2. What is a good productivity percentage for remote teams?
A common starting point is 55% to 75% productive time, but the “right” number depends on role, meeting load, and tools.
3. Should idle time count as unproductive time?
Not always. Meetings, reading, and thinking often look idle in keyboard and mouse signals. Configure exclusions and use manual entries where needed.
4. How do you set employee productivity benchmarks without micromanaging?
Use productivity baselines first, focus on trends and outcomes, and limit monitoring to necessary signals with clear communication and employee access.
5. What metrics matter most for hybrid team productivity tracking?
Use a small scorecard: productive time trends, meeting load, utilization for billable roles, and delivery outcomes. Keep definitions consistent.
6. Is AI-powered time tracking ethical?
It can be, if you use it to improve workflows and prevent burnout, not to pressure constant activity or invade privacy. Policy and defaults matter more than the tool.
7. Do productivity metrics for distributed teams hurt trust?
They can if used as surveillance. Trust improves when employees understand what is tracked, why, and how it will be used.