Profitability Tracking for Design & Creative Agencies
Key Takeaways:
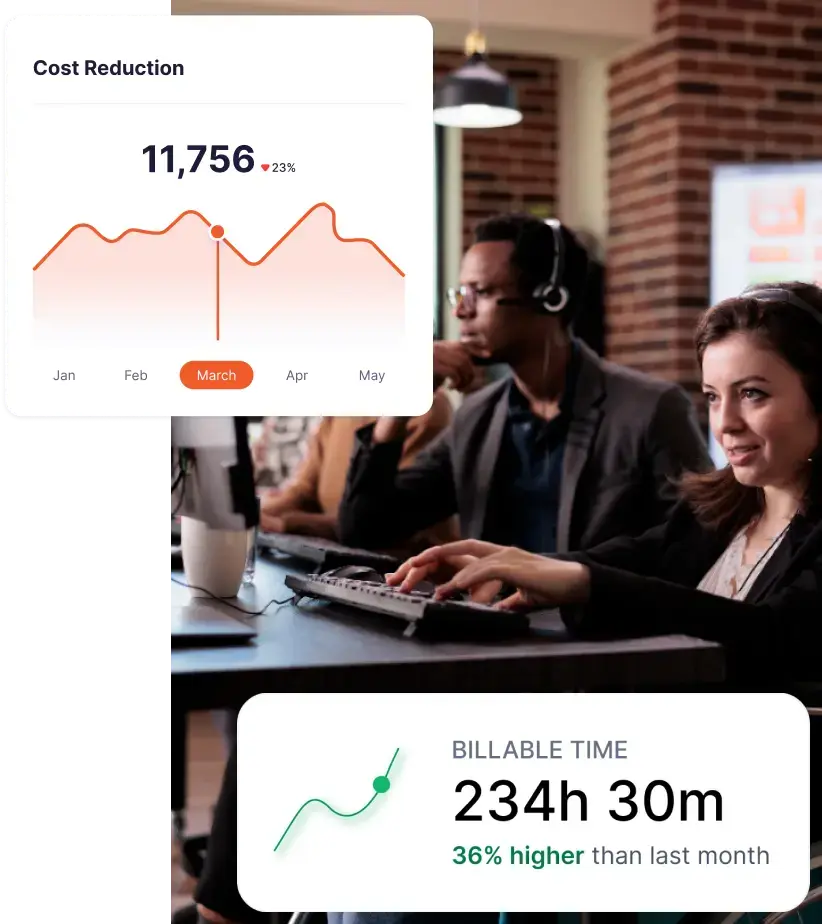
- Being busy doesn’t equal being profitable: A full pipeline and happy clients can still hide margin erosion if you lack visibility into delivery costs.
- Profitability depends on visibility, not effort: Without accurate, automatic insight into how time is spent, profitability tracking becomes guesswork.
- Creative projects are inherently hard to scope: Evolving briefs, feedback loops, and revisions make fixed pricing and retainers risky without strong cost tracking.
- Labor is the largest and most volatile cost: If time data is inaccurate or incomplete, every margin calculation built on it is unreliable.
- Gross margin and net margin must be tracked separately: A project can look profitable at the delivery level while the business remains unhealthy overall.
- Scope creep is the biggest silent margin killer: Small, untracked changes accumulate into major profit leaks when effort isn’t surfaced early.
- Utilization has an optimal range: Creative teams perform best around 65–75% utilization; pushing higher leads to burnout and quality loss.
- Effective billable rate reveals hidden inefficiencies: Comparing planned vs actual rates exposes underestimation, overruns, and pricing mistakes.
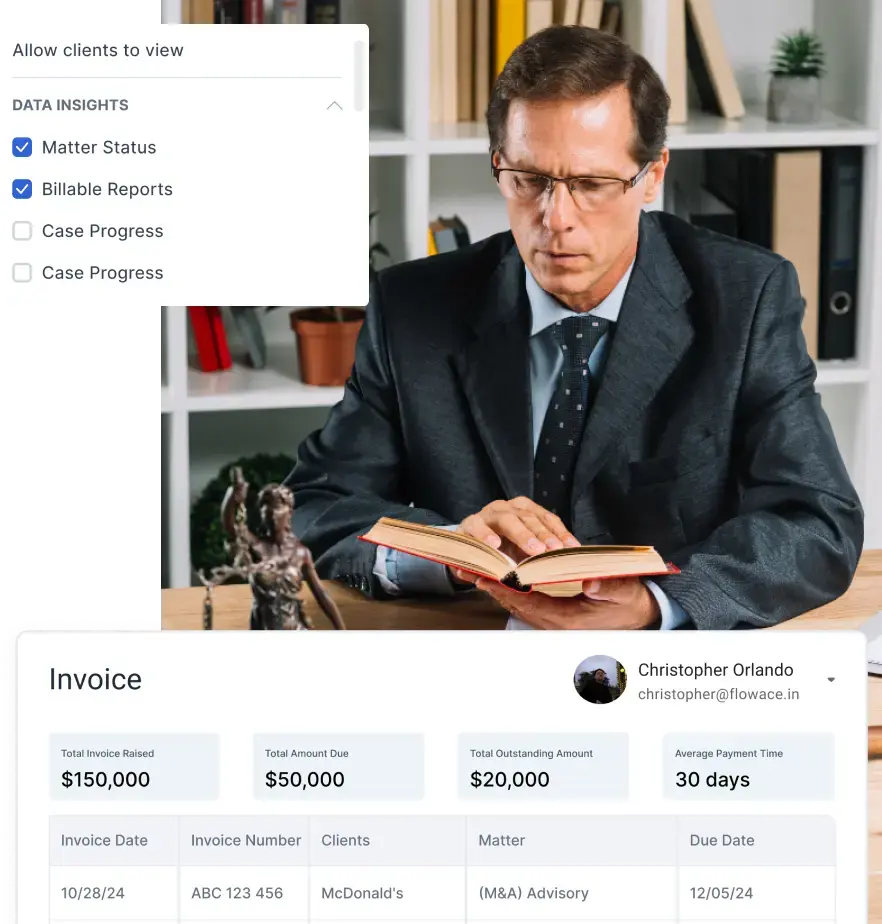
- Profitability must be measured by project and by client: Knowing true cost per project and per client enables better pricing, staffing, and scope decisions.
- Passive time capture enables sustainable profitability: Automated, non-intrusive tracking turns hidden effort into actionable data—protecting margins without disrupting creative flow.
If being busy automatically meant being profitable, you wouldn’t be worrying about margins in the first place. Yet, most creative agencies still feel uneasy when you look at the profit margin, even when they have a full project pipeline and satisfied clients.
As a creative agency, you’re working with projects that are inherently hard to scope. Fixed fees and flat retainers make this worse by masking the true cost of delivery. That lack of cost transparency only becomes visible when you can clearly see where your employee’s time is actually being spent.
Without automatic, reliable visibility into how your team’s time is actually distributed, profitability tracking in design and creative agencies remains largely a guesswork
What is Profitability for Design & Creative Agencies?

At the project level, the math is straightforward:
Project Profit = Project Revenue – (Labor Costs + Overhead Costs)
Profit Margin (%) = Profit ÷ Revenue × 100
Say a client pays you $10,000 for a branding project. If it takes 60 hours of designer time at $50 per hour ($3,000 in labor) and another $1,000 in tools and overhead, you’re left with $6,000 in profit, which is a 60% margin. Clean on paper.
Where agencies get tripped up is in separating gross margin from net margin. Gross margin tells you whether a project covers its direct delivery costs. Net margin tells you whether the business is actually healthy after everything else is paid for.
Across the industry, many creative and digital agencies operate with a 10% net margin, while a margin of 15–20% is generally considered healthy.
That means for every $100 you bill, only about $10 is profit. Small errors in this cost tracking or pricing can even halve your margins without you noticing. That’s also why profitability needs to be measured at more than one level. You need clarity at both the project and client levels.
Hourly rates alone won’t save you either. The moment a project runs beyond its quoted hours, your effective rate drops. Quote 10 hours at $100 per hour, deliver 15, and you’re only earning $66 per hour.
This is why time data matters more than most agencies admit. Labor is your highest cost. If you don’t know exactly who worked on what, for how long, your cost calculations are off. And every margin number built on top of them is questionable.
Why “Scope Creep” is the Silent Killer in Creative Agencies
Creative work is rarely linear, and scope creep often sneaks in through small, well-intentioned changes. Most of the time, no one flags it as a problem because the work still gets done and the client stays happy.
Once the scope expands, the connection between price and effort disappears. You quoted a fixed fee or retainer for a specific outcome, but the workload grows without any adjustment to pricing. Because the extra tasks are minor and fragmented, they’re often tracked poorly or not tracked at all.
Each additional feedback round compounds the problem. Writers, designers, and project managers all touch the work again, creating rework loops that weren’t planned for. Over time, the burden tends to fall on your strongest people, increasing burnout and dragging down quality.
Scope creep is usually enabled by vague briefs, informal change approvals, and weak visibility into how time is actually spent. Preventing it requires discipline: clear scopes, formal change requests, task-level tracking, and regular scope checks. Automated tools like Flowace help surface hidden effort, making it easier to renegotiate, analyze overruns, and turn scope creep from a silent margin killer into a manageable risk.
Core Profitability Metrics Every Design and Creative Agency Must Track
Tracking a few core metrics helps you spot these profitability issues early:
Billable vs Non-Billable Hours
Billable hours are work you can invoice; non-billable time includes internal meetings, admin, training, and revisions. On its own, non-billable time doesn’t seem costly, but over time, it quietly eats into your margins.
Usually, a one-hour client call gets billed, but the prep beforehand or follow-up emails afterward often don’t. Multiply that across projects, and the leakage becomes huge.
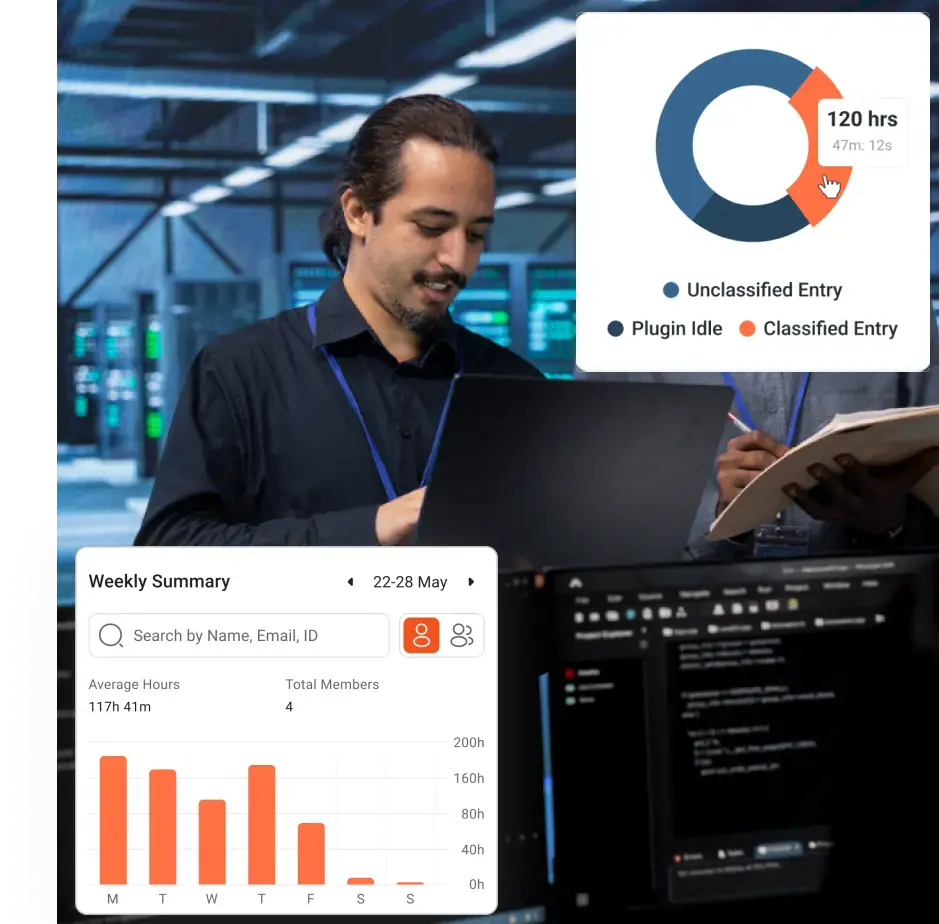
That’s why separating billable from non-billable work matters. When you can see exactly where time goes, you can reduce unnecessary non-billable effort and protect margins. Modern tools can help you in this process by automatically classifying time by project and task. Flowace makes this separation automatic by tracking and categorizing time across projects and tasks, without relying on manual entries.
Utilization Rate
Utilization rate is one of the most misunderstood metrics in design and creative agencies.
Formula: (Billable Hours ÷ Available Hours) × 100%.
For example, if a designer works 40 hours but only 28 are billable, utilization is 70%.
Where teams go wrong is in treating higher utilization as automatically better. Targeting 100% utilization isn’t realistic for creative work, because they leave no capacity for other non-billable but essential activities. On average, for creative agencies, a healthy utilization rate tends to land around 65–75%.
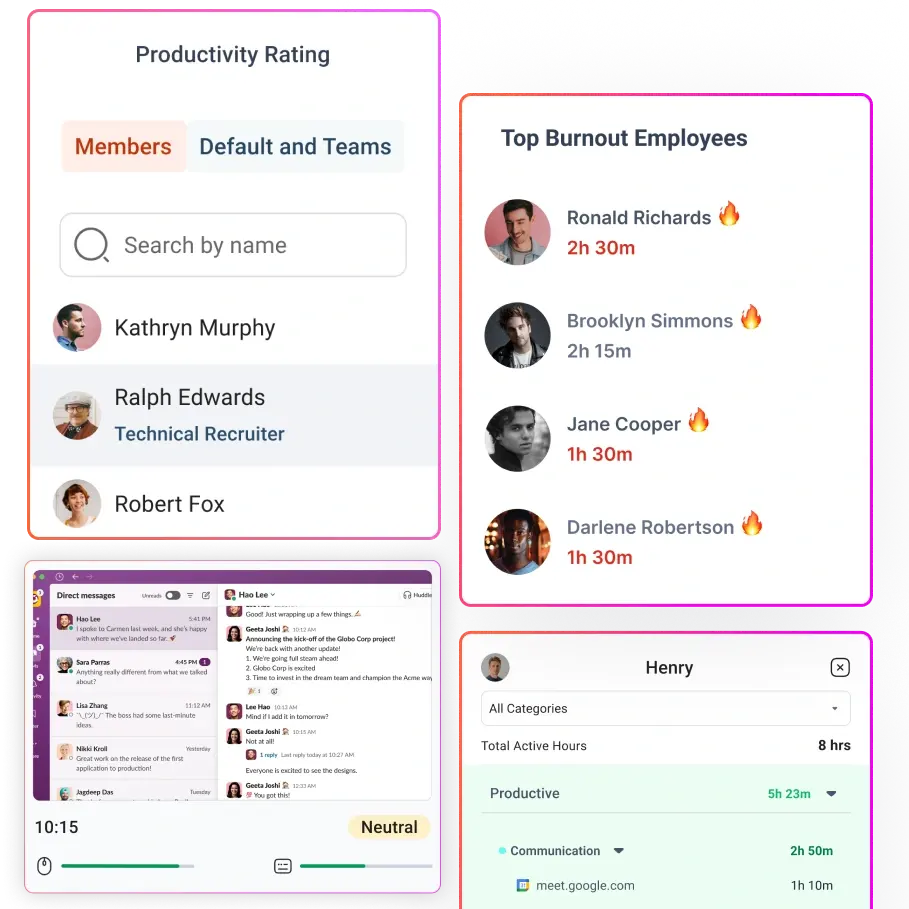
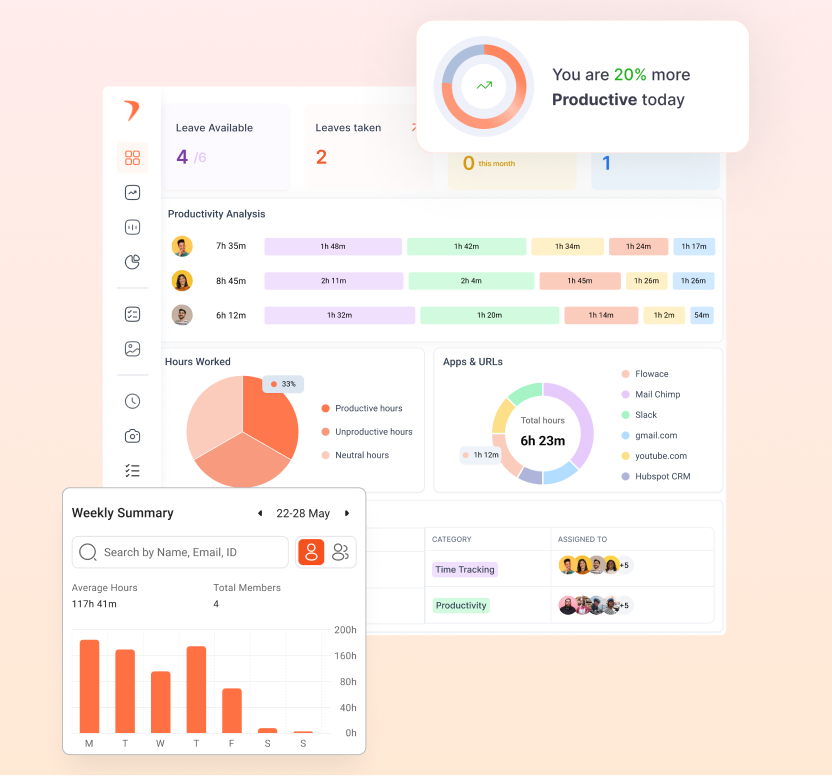
Too low (<50%) and you’re carrying idle capacity; too high (near 100%) and you risk burnout and quality issues. The key is real-time visibility. Flowace makes this easy by showing productivity dashboards, highlighting when someone is trending toward 90% or more, and helping you redistribute tasks.
That way, you maintain productivity, protect your team’s well-being, and make sure your most skilled people aren’t suffering from burnout.
Effective Billable Rate (Planned vs Actual)
The effective billable rate shows how much revenue you actually earn per hour compared to what you planned. It’s a direct measure of efficiency and scope creep.
For example, if you planned for an 80% utilization at $120/hr but the project ends up taking 20% more time than estimated, your effective rate drops. Over time, these gaps between quoted and actual hours quietly reduce profitability.
Tracking estimated versus actual hours at the task level lets you see which projects consistently overruns, so you can take corrective action.
Cost Per Project & Cost Per Client
To understand profitability, you need to know what each project and client actually costs you. You have to account for the time, revisions, meetings, and overhead when calculating labor cost.
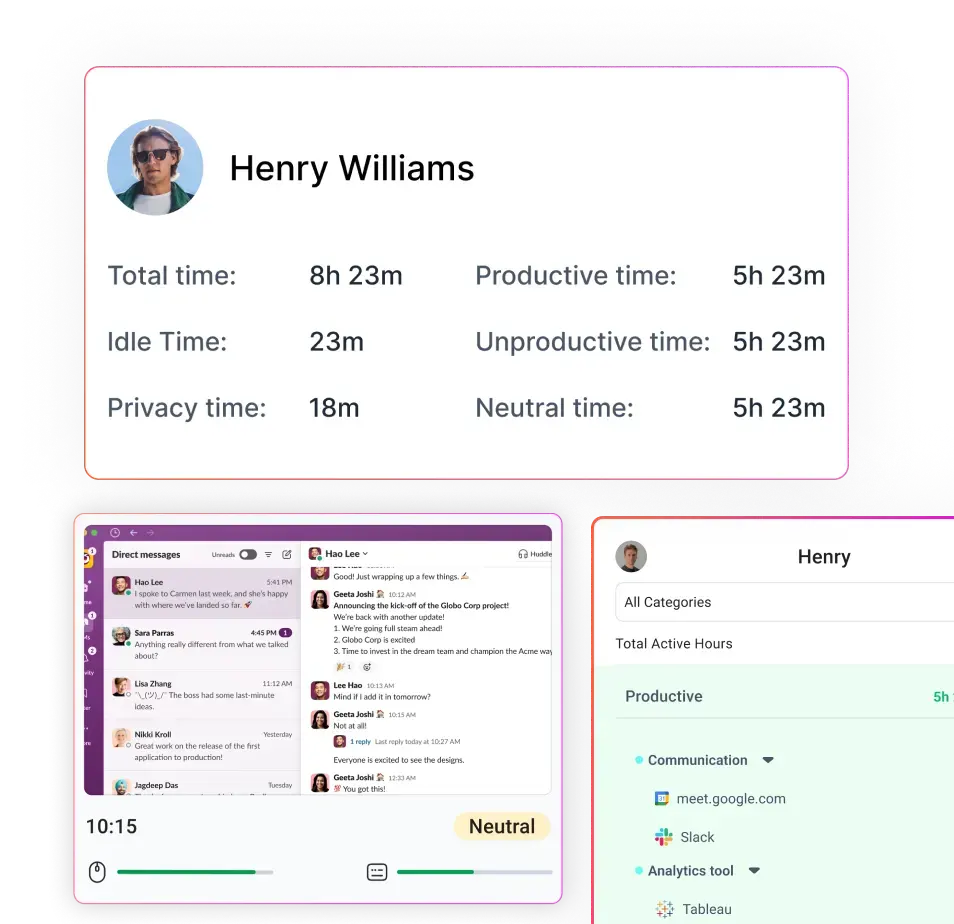
Tracking these requires continuous, passive time capture that follows team members throughout their day. When you capture all work (billable or not), you can calculate true project labor cost and thus an accurate profit.
Where Creative Agencies Lose Profit (Real-World Scenarios)
- Unlogged “Quick Fixes”: Your top designer tweaks a design detail for a client after hours. Because it was quick, she doesn’t enter it in the timesheet. Those 15 minutes are valuable billables lost. Over many such edits, unbilled effort accumulates.
- Revisions & Feedback Loops: Multiple rounds of client feedback (color changes, copy edits, additional pages) can double original estimates. If you don’t capture that extra time, every revision eats into profit margin.
- Forgotten Meetings: Weekly planning sessions, brainstorms, or client chats often aren’t entered as time. Creative agencies sometimes mark everything as “meeting” and do not charge it. These non-billables quietly reduce effective utilization.
- Overworking High Performers: Your best people end up late often because they’re passionate. Without a system, they might not log overtime work, or they become unsustainable. Meanwhile, other team members aren’t fully utilized. This imbalance leads to burnout of key staff and wasted capacity elsewhere.
- Loose Scope Discipline: Informal scope creep like additional email requests or unplanned “adding just one more slide,” are common. Without project time caps, these erode profit margins.
Each scenario has one solution in common: capture work as it happens.
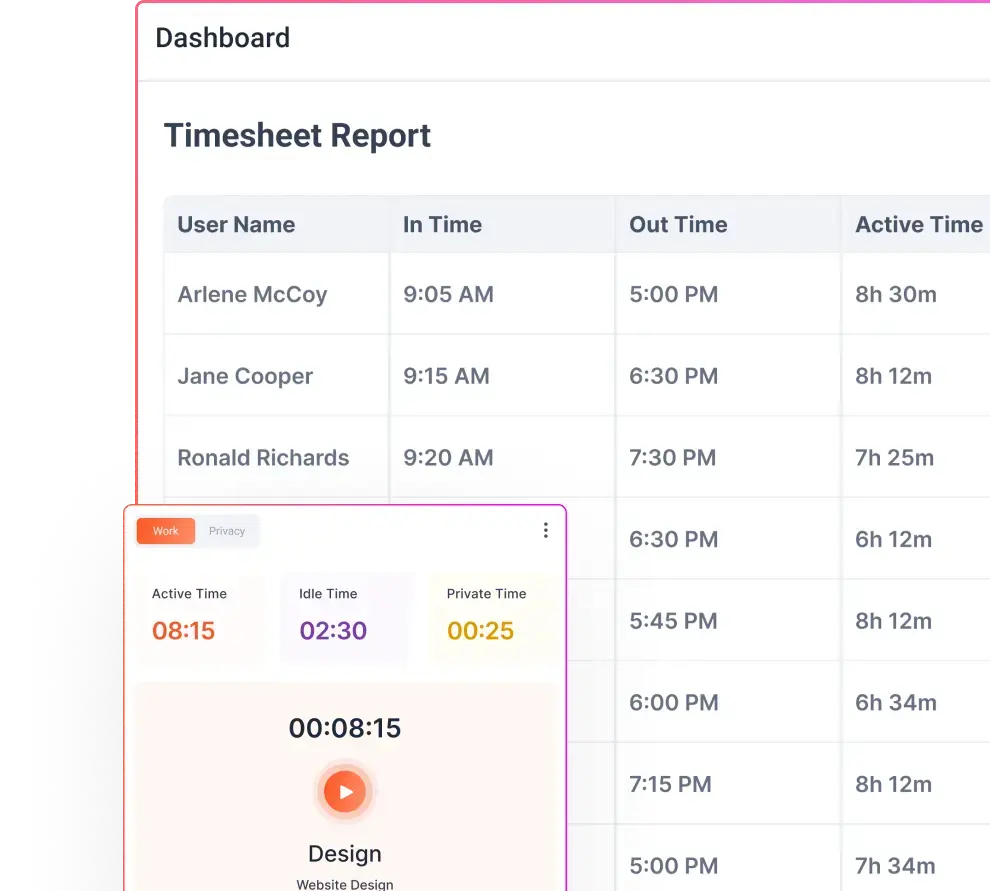
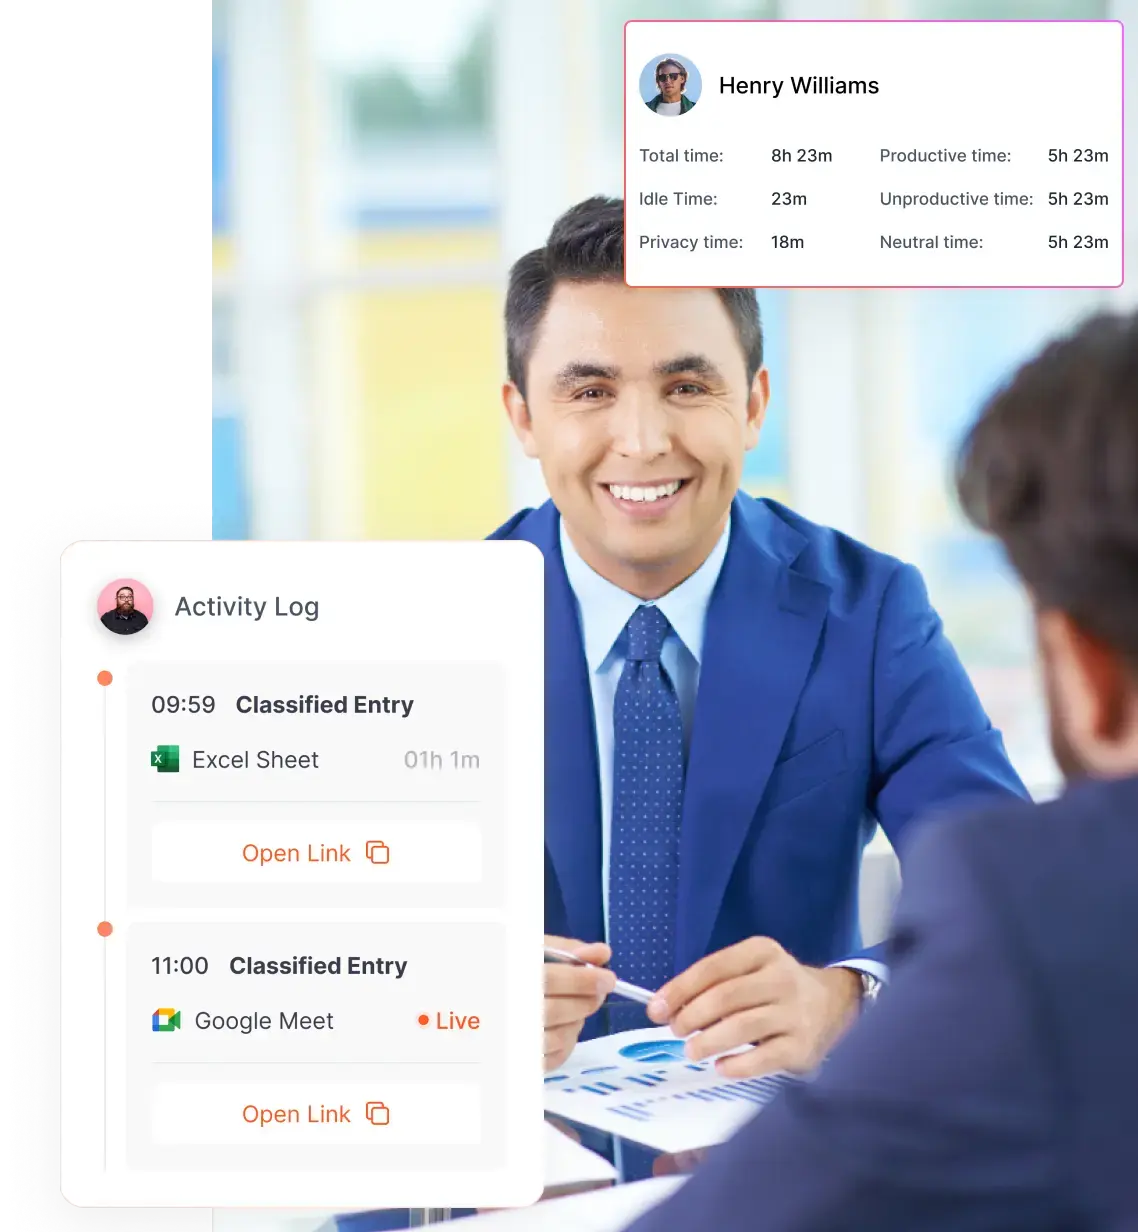
Modern time trackers like Flowace log activity automatically, so there’s no reliance on memory. For instance, Flowace runs in the background and notes when a designer switches between Photoshop, email, and Slack. It then attributes those minutes to the active project. With this data, your reports instantly show where time went.
Top 5 Tools to Protect and Improve Agency Profit Margins
If your goal is to protect creative margins without forcing your designers to interrupt work, start with a creative-friendly approach. Below are five practical tool choices, the role each plays in margin protection, and when to pick them.
Flowace.ai
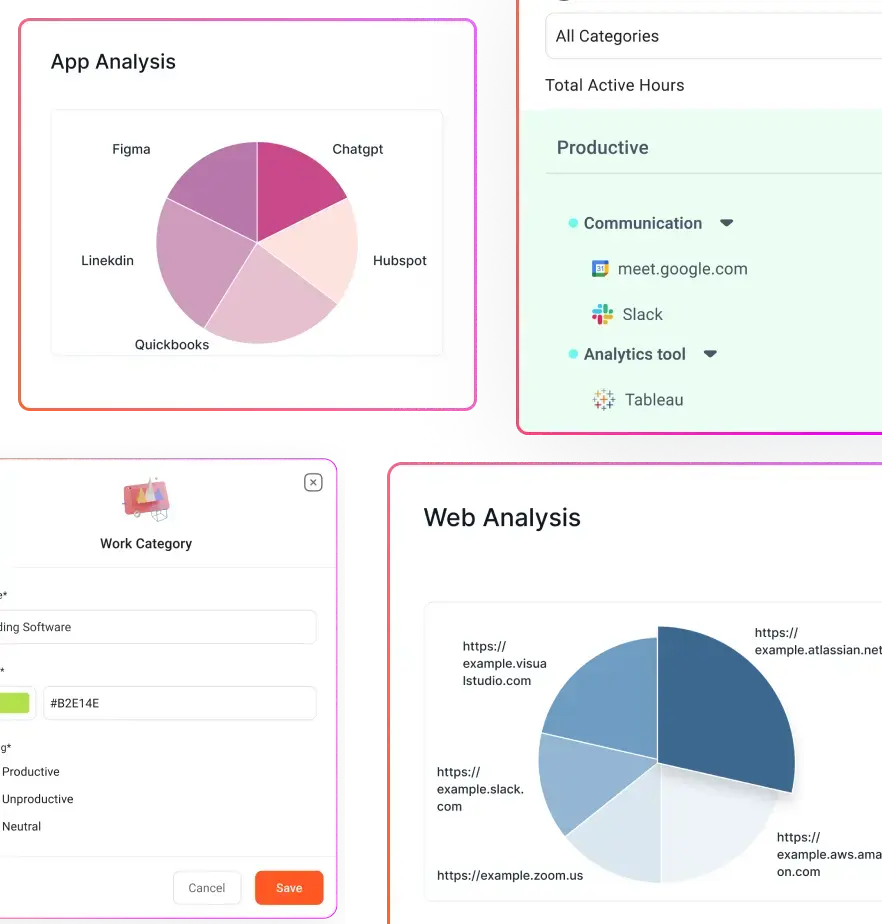
Flowace is built for design-heavy teams that need deep time visibility without interrupting creative flow. It passively captures app and document-level activity, automatically grouping work by project and task so you don’t rely on end-of-day memory. Because it can record file-level context, you get clearer distinctions between client work and internal work, which improves billing accuracy and post-project audits.
Key Features:
- Passive activity capture (apps and website monitoring, docs, file-level context)
- Automatic classification by project and task
- Utilization and margin dashboards
- File-level context for more accurate billing
When to pick it:
Choose Flowace when you need non-intrusive, designer-friendly tracking that turns background activity into reliable billing and profitability data.
Harvest
Harvest is a mature, straightforward time and expense tool focused on turning hours into invoices quickly. It relies primarily on manual timers and entries so teams consciously log work, which makes it ideal for groups that already have time-tracking habits. Harvest’s strength is its clean invoicing flow, expense capture, and simple project reporting.
Key Features:
- Manual timers and time entry
- Built-in invoicing and expense management
- Simple project and client reports
- Integrations with PM and accounting software
When to pick it:
Pick Harvest if your team already logs time and your priority is polished invoicing and easy billing workflows.
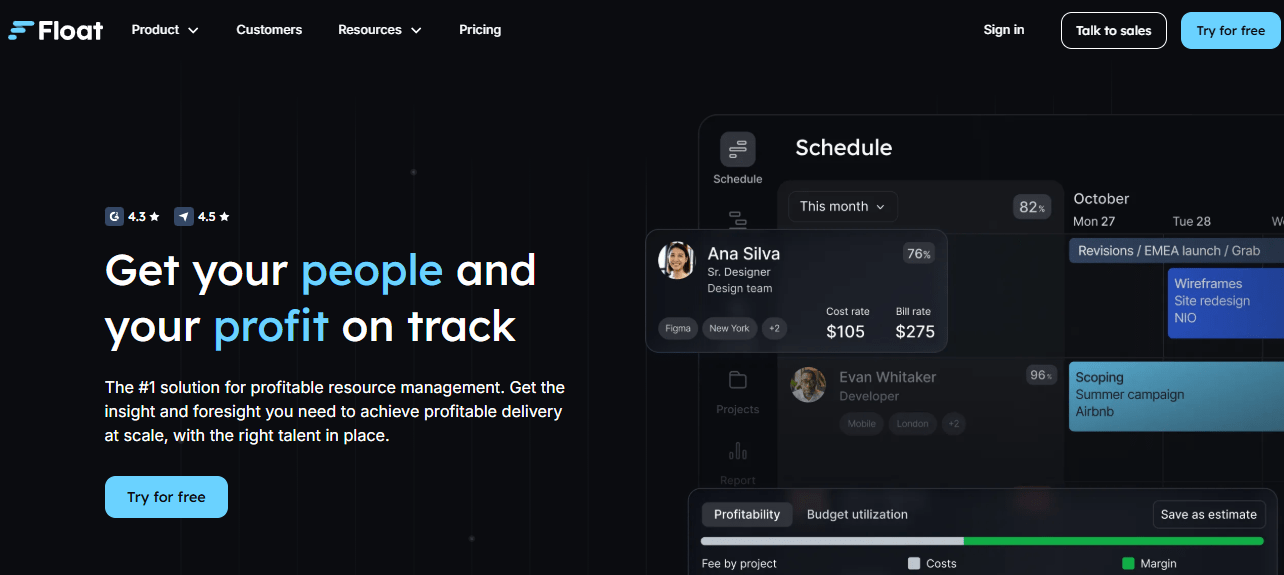
Float
Float is a visual resource and capacity planning tool that helps you forecast who is available, when, and for how long. It centers on drag-and-drop scheduling, giving you a clear, at-a-glance calendar of assignments, leave, and bench time. Float does not try to be a deep time-capture system. Instead, it focuses on allocation and forecasting so you can avoid double-booking and predict staffing gaps.
Key Features:
- Drag-and-drop resource calendar
- Team availability and leave management
- Project allocation and forecasting
- Capacity heatmaps and timeline views
When to pick it:
Use Float when scheduling and capacity planning are the primary issues, and you need a clear visual of future availability.
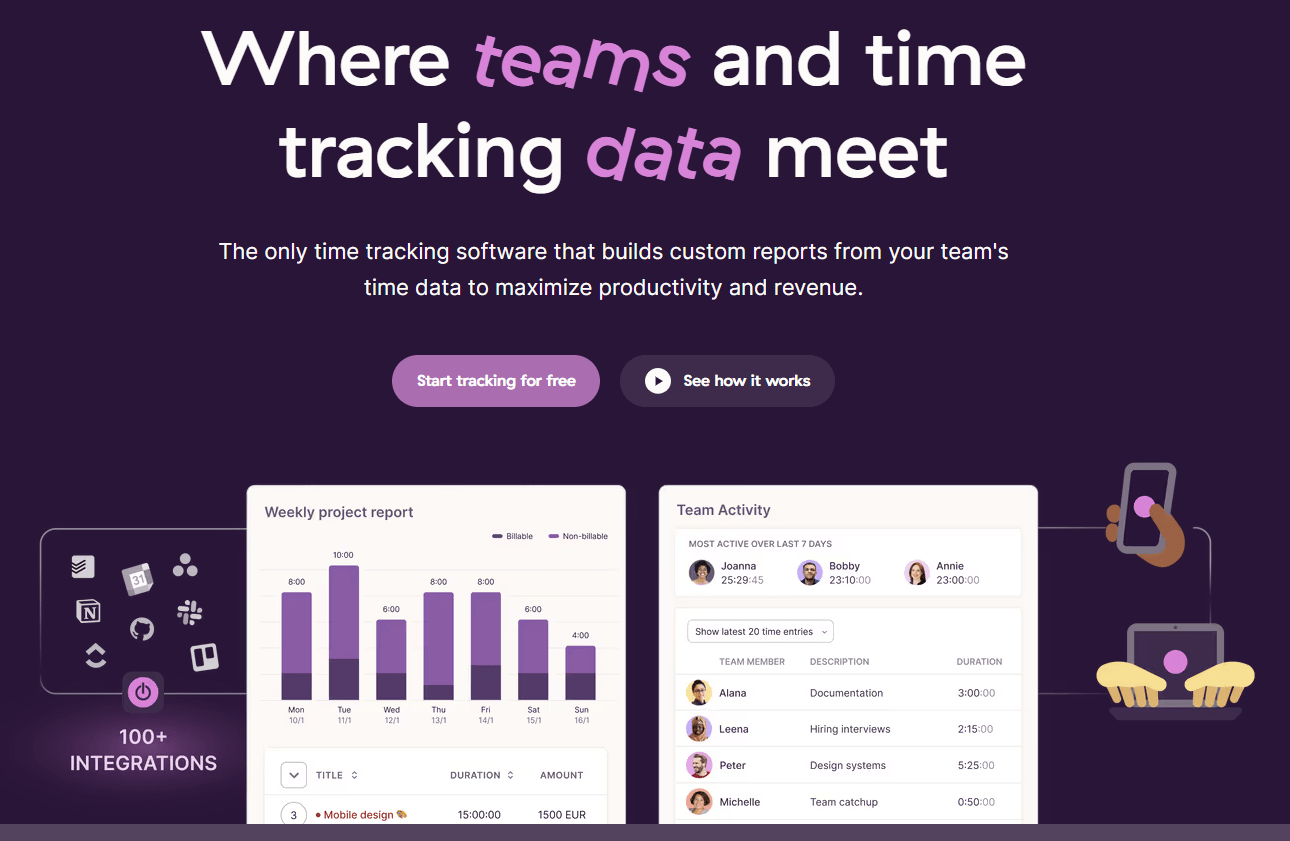
Toggl Track
Toggl Track is a lightweight, user-friendly time tracker designed for quick adoption. It offers one-click timers, simple manual entries, and easy reporting so individuals and small teams can capture billable hours with minimal training. The interface is intentionally low-friction and visually friendly, which helps drive consistent usage. Toggl provides basic productivity and billable reports and integrates with many popular tools, but it stops short of deep profitability analytics or passive context capture.
Key Features:
- One-click timers and manual entries
- Simple, intuitive interface
- Basic reporting and exports
- Wide range of integrations
When to pick it:
Choose Toggl when adoption is your main barrier and you need a quick, easy way to capture billable time.
Productive.io
Productive.io is an all-in-one platform aimed at agencies that want to combine sales, project delivery, and financials in a single system. It links pipeline and resource planning to time tracking and profitability dashboards, so you can trace revenue from lead to invoice and measure margin by project or client. The platform is feature rich, covering project management, resourcing, invoicing, and financial reporting, but that depth comes with implementation complexity. Productive is powerful for agencies ready to centralize operations and invest in configuration.
Key Features:
- Integrated project management and time tracking
- Sales CRM and pipeline features
- Financial reporting and profitability dashboards
- Resource planning and invoicing
When to pick it:
Select Productive.io if you want an enterprise-style, integrated system and can allocate time and resources for setup and change management.
Final Takeaway
If you take one thing from this guide, make it this: profitability is about visibility, not willpower. You can be busy and still lose money if you do not capture the true cost of delivery. The agencies that stay profitable measure time precisely, separate billable from non-billable work, track utilization and effective billable rate, and calculate cost per project and per client. Those metrics turn guesswork into decisions.
You do not need to build this from spreadsheets alone. If you want non-intrusive visibility that preserves creative flow, consider a creative-first tracker like Flowace to make hidden effort visible and speed up accurate invoicing and scope decisions.
If you want a repeatable way to understand where margins are actually made or lost, book a free demo or start a free trial with Flowace today to see how automated time capture and simple dashboards can protect your margins.
FAQs
Q: What is profitability tracking for a creative agency?
A: Profitability tracking means measuring revenue vs all costs (especially labor) at project and client levels. It involves collecting accurate time data, calculating profit and margin formulas, and monitoring metrics like utilization and billable hours. This tells you exactly which services and projects are actually earning money.
Q: Why is time tracking important for design agencies?
A: Time tracking is the foundation of profitability. Accurate logs ensure you invoice for all billable work and know real labor costs. Without it, you miss unpaid hours and can’t calculate true project profitability. Automated tools eliminate guesses and capture hidden work that eats into margins.
Q: What’s the difference between billable and non-billable hours?
A: Billable hours are work you can charge a client for (design, coding, client meetings). Non-billable hours include internal meetings, admin, training, or revisions not charged. Tracking both separately is crucial – too much non-billable time erodes profit.
Q: Is tracking employee time invasive or unethical?
A: It doesn’t have to be. Ethical time tracking focuses on outcomes, not snooping. Use privacy-friendly tools: show individual users what’s tracked, allow break periods, avoid constant screenshots. Emphasize benefits (fair workload, accurate pay) over surveillance. Consent and transparency make it respectful, not intrusive.
Q: How can I use Flowace to improve my agency’s profitability?
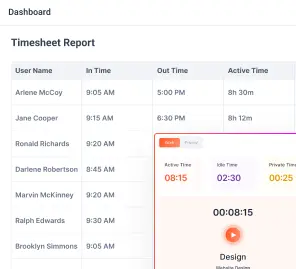
A: Flowace automates the steps above. It captures every working minute, classifies tasks (billable vs non), and provides real-time dashboards for utilization and productivity. With Flowace you can compare estimated vs actual time per project, identify scope creep early, and generate accurate timesheets for billing. This data lets you optimize pricing and staffing based on facts, not guesswork.
Q: What if my agency currently uses flat-rate pricing?
A: Flat fees make accurate internal costing even more important. Track all work on each project to see if the flat price covers it. If not, you’ll spot losses early. Use historical time data to refine flat fees or switch to value-based pricing models. In either case, profitability tracking reveals how well your prices align with effort.