Key Takeaways
- Productivity drops show up first in small, visible patterns like increased meetings, app switching, and after-hours work.
- Predictive workforce analytics helps you move from reactive reporting to early intervention by using historical data and real-time work signals.
- Fragmented work is a major hidden risk. Interruptions, search time, and constant communication reduce focus long before KPIs reflect a problem.
- Productivity debt builds quietly. Coordination overload, meeting sprawl, and catch-up work eventually lead to slower delivery, lower quality, and disengagement.
- Context switching, latency in starting meaningful work, and collaboration overload are three early warning signals you should monitor closely.
- Workforce productivity analytics should not mistake activity for progress. High engagement with tools does not always translate to meaningful output.
- Accurate employee productivity forecasting depends on combining multiple signals, including work patterns, focus time, engagement data, and team trends.
- Looking at operational data and people signals together gives you a clearer picture of productivity risks than isolated metrics.
- Workflow-level visibility is critical. You need to understand how work happens, not just what gets delivered.
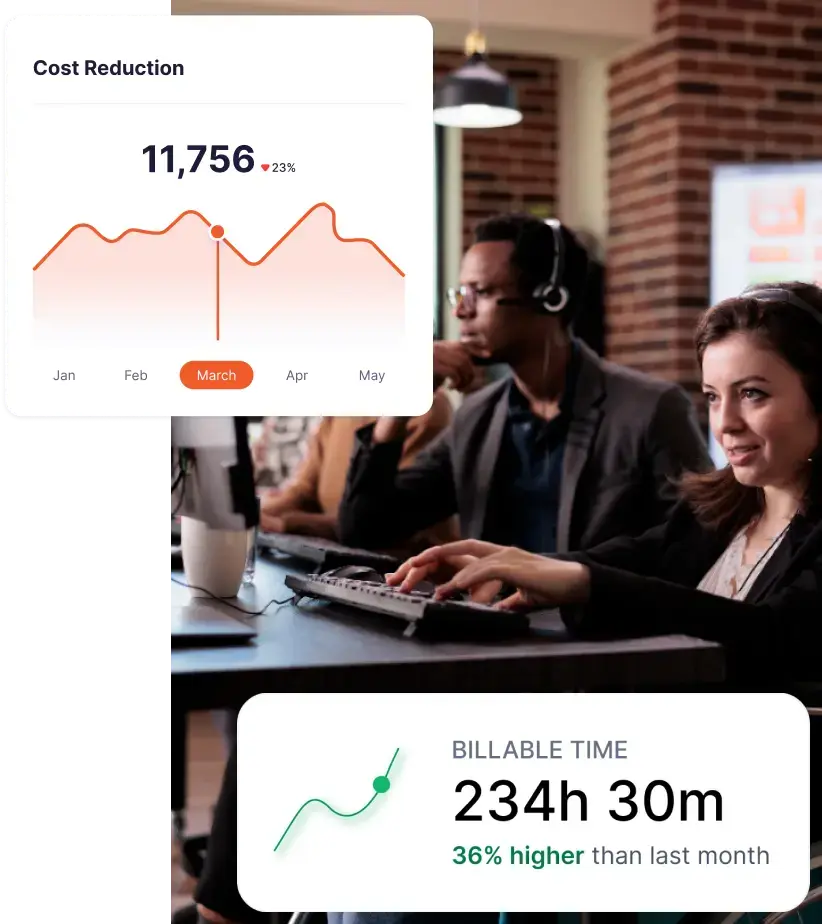
- Flowace helps you track, analyze, and act on real-time productivity signals so you can reduce friction, rebalance workloads, and improve output before issues escalate.
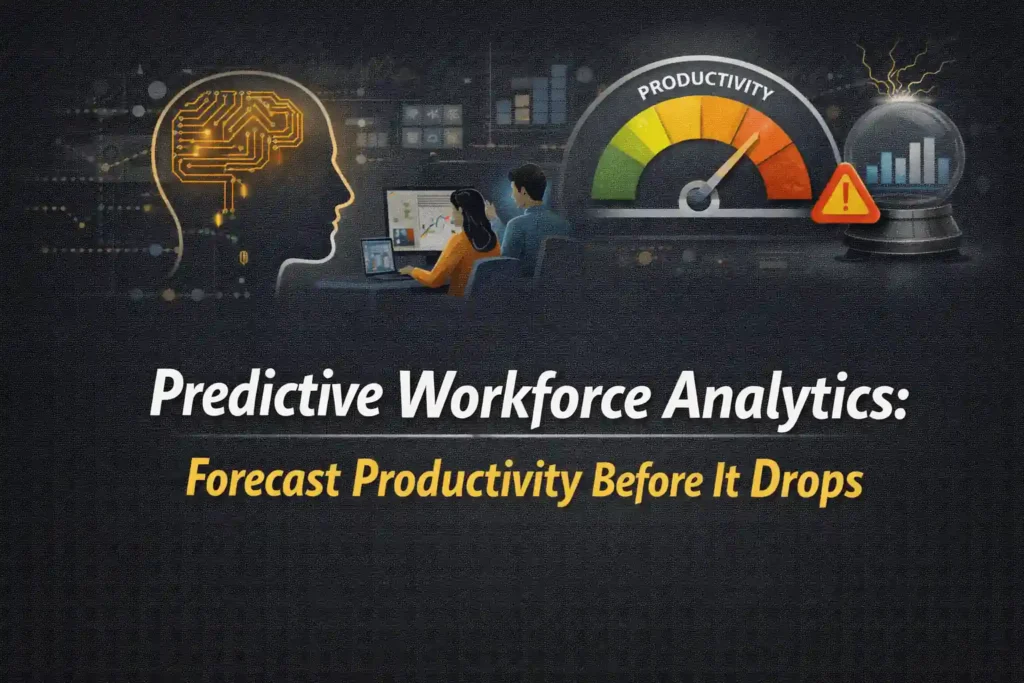
Most teams do not lose productivity all at once. It slips in small, visible patterns first. More ad hoc meetings. More after-hours work. More app switching. More time spent “busy” without meaningful output. That is where predictive workforce analytics becomes useful. It helps you spot the signals that show up before missed deadlines, burnout, or falling performance become obvious in monthly reports.
In simple terms, predictive workforce analytics uses historical workforce data and real-time work signals to forecast what is likely to happen next. That could mean predicting a productivity dip, spotting workload imbalance, identifying burnout risk, or seeing where delivery may slow down before it becomes expensive. The shift is from descriptive reporting, which tells you what already happened, to predictive analysis, which helps you act earlier.
What Is Predictive Workforce Analytics?
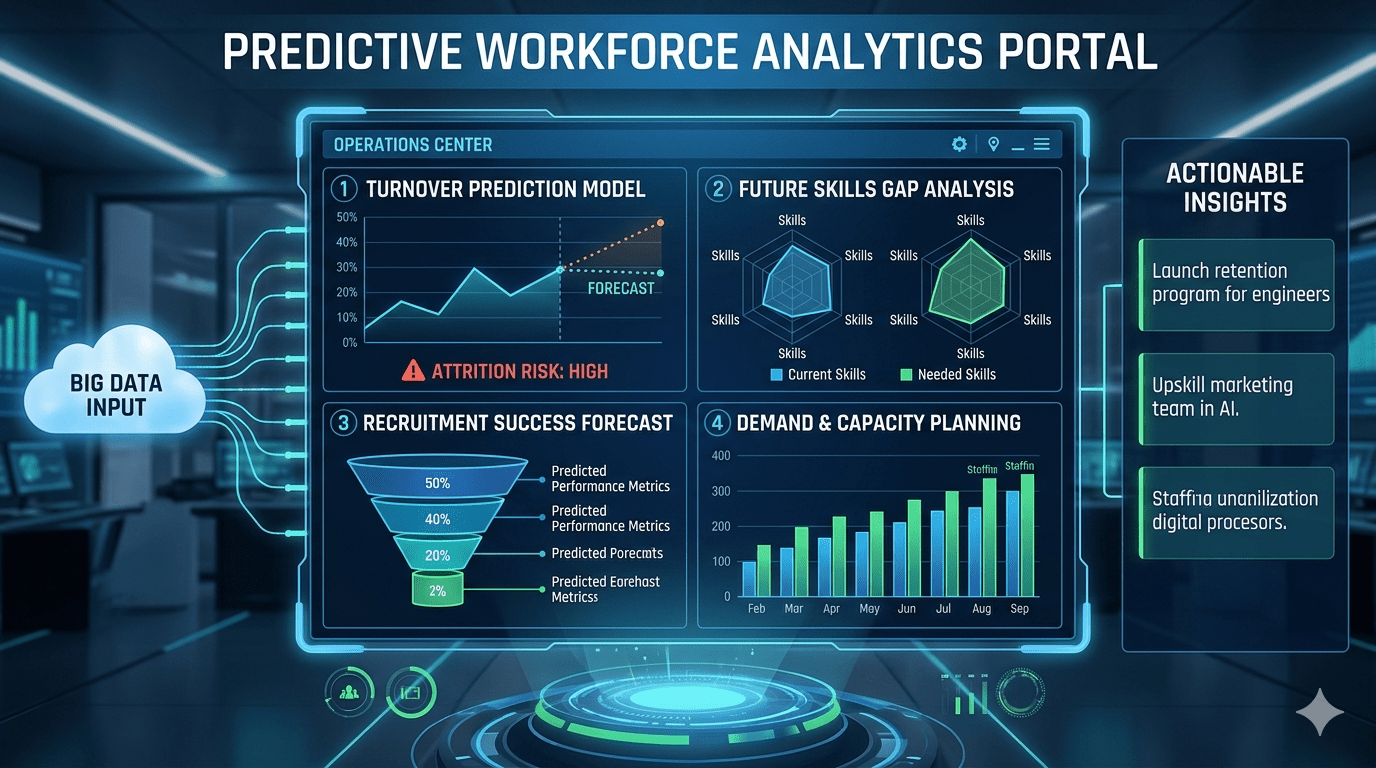
Predictive workforce analytics combines historical employee data, current work patterns, and statistical modeling to anticipate what is likely to happen across your workforce. Most articles focus on outcomes like attrition, hiring needs, skills gaps, or performance trends. Those are useful, but if you are leading operations or managing teams, your immediate concern is to see productivity shifts before it’s too late.
This is exactly why the topic is becoming more relevant now. According to Microsoft’s 2025 Work Trend Index, employees are interrupted every two minutes during core work hours, and a majority of meetings happen spontaneously rather than being planned. These are not just minor workplace annoyances. They are early indicators of fragmented work. Over time, that fragmentation reduces focus, disrupts deep work, and gradually impacts output well before your KPIs start reflecting a problem.
The Real Cost of Fragmented Work in Modern Teams
Productivity declines usually leave a trail. The problem is that many teams do not look for the right trail.
Atlassian’s 2025 State of Teams research found that teams waste 25% of their time searching for answers. That lost time does not always show up as absenteeism or low logged hours. It often hides inside status checks, message chasing, duplicated effort, and tool friction.
Microsoft also found that chats sent outside 9-to-5 were up 15% year over year, with the average employee receiving 58 messages before or after work hours. Another 2025 Microsoft release reported that 40% of employees check email before 6 a.m., meetings after 8 p.m. are up 16% year over year, and the average employee receives 117 emails and 153 Teams messages daily. That is not healthy productivity. That is work expanding into every available hour.
This is where a better operating concept helps. Think of it as productivity debt. Your team may look fine on the surface, but coordination overload, search time, meeting sprawl, and after-hours catch-up create hidden debt. Eventually, that debt converts into slower delivery, lower quality, fatigue, and disengagement.
How Predictive Analytics Outperforms Manual Monitoring?
Manual monitoring is usually too slow, too subjective, and too inconsistent. It depends on manager memory, anecdotal impressions, or spreadsheet-based reporting. That makes it hard to detect subtle trend changes across teams.
Predictive systems work better because they look for patterns over time. They can show whether a team’s productive time share is falling, whether interruptions are rising, and whether after-hours work is becoming a coping mechanism. That is very different from watching screenshots all day or judging people by online presence.
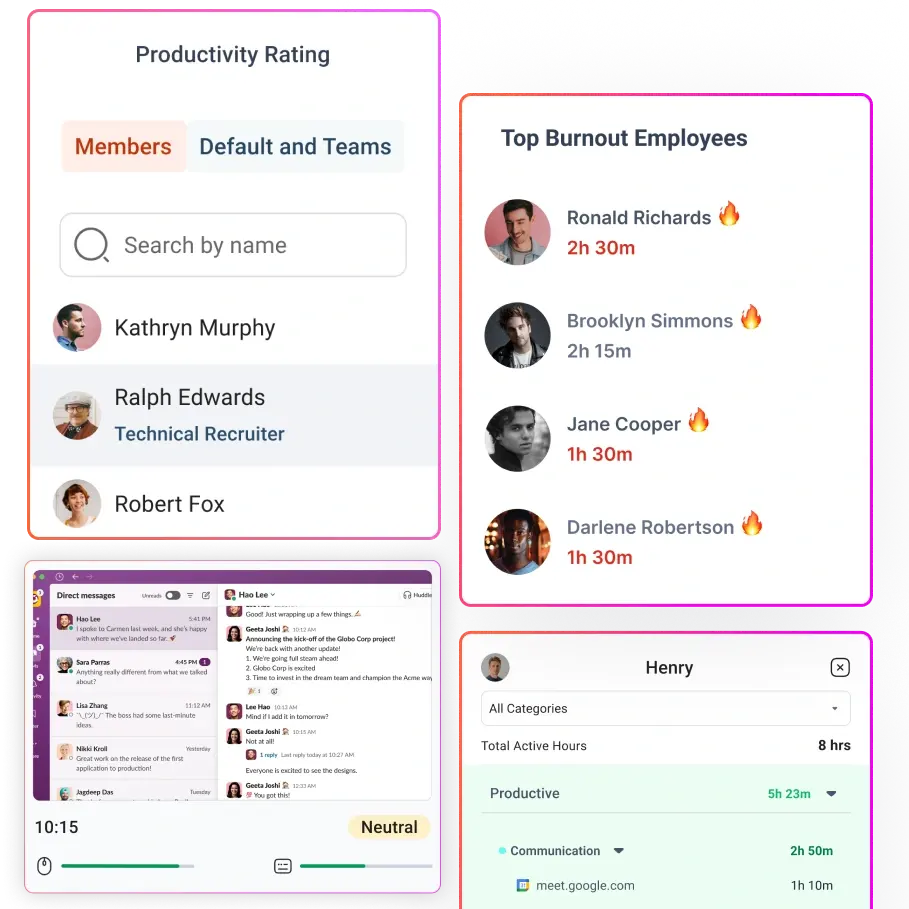
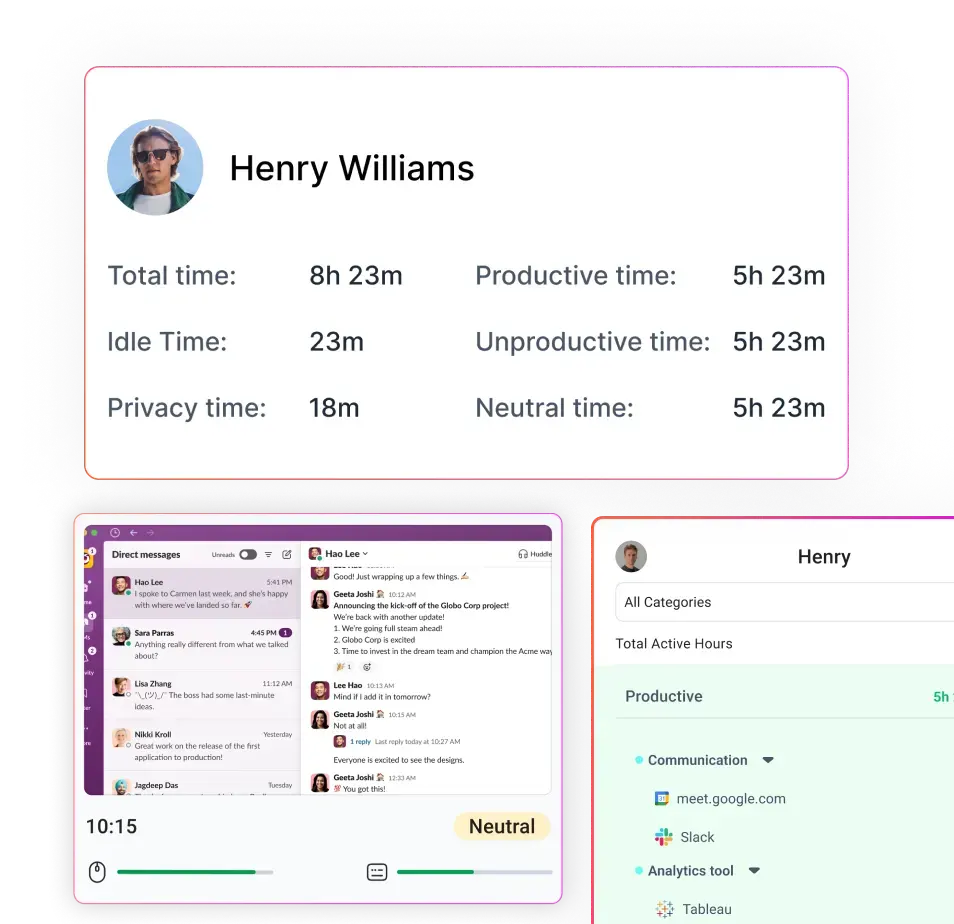
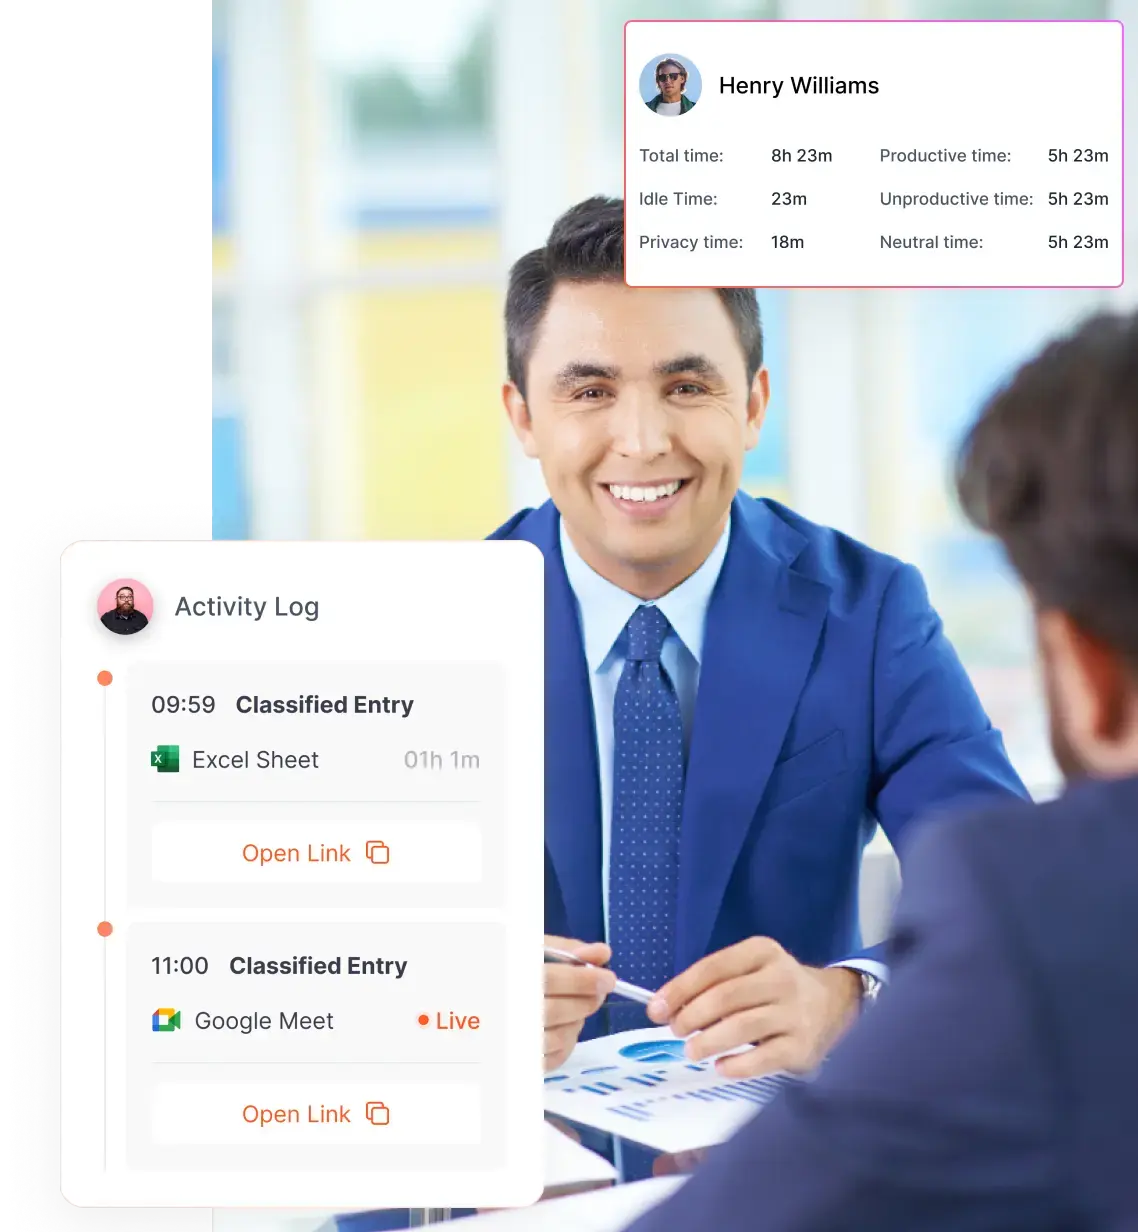
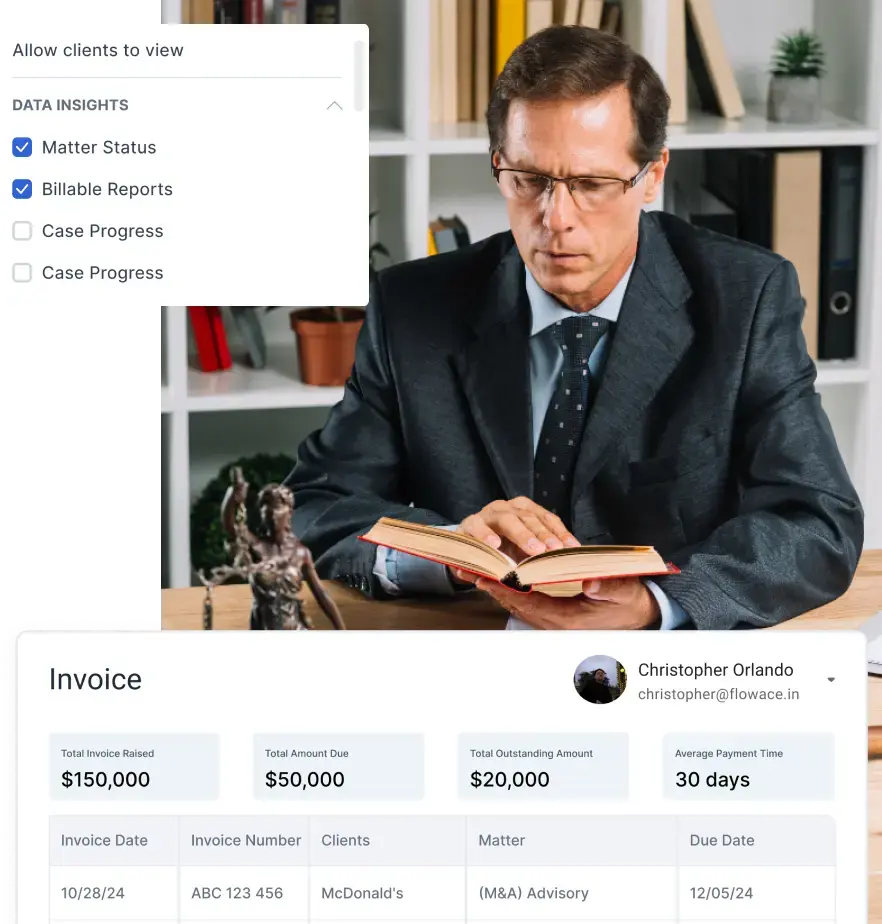
This distinction matters for trust. Flowace’s own product pages emphasize responsible monitoring, custom real-time alerts, configurable productivity ratings, dashboards, and privacy-oriented controls like privacy mode rather than a pure surveillance-first model. That is the healthier framing for workforce performance analytics. You want signals that improve systems, not tools that make employees feel constantly watched.
The 3 Early Warning Signals Of A Productivity Drop
Most productivity drops are predictable. The problem is that you are often looking at the wrong indicators.
Here are 3 Here are 3 early warning signals you should pay attention to before your team’s productivity drops beyond recovery:
1. The Context Switching Spike
When your team keeps jumping between apps, chats, tabs, and meetings, they are not just staying busy. They are constantly resetting their attention. Over time, that reduces the amount of meaningful work they can complete.
Research shows how costly this behavior really is. More than 97% of people experience a drop in productivity when they switch context, even if they believe they are handling it well. Only about 2.5% can effectively manage multiple complex tasks without a decline in performance
This is where workforce productivity analytics needs to be precise. You cannot treat constant activity as progress. A team can appear active throughout the day and still lose significant output to interruption drag.
2. The latency gap
Another early signal is the latency gap, which is the time it takes for someone to get into high-value work. If you notice that meaningful tasks keep getting pushed later into the day, or that deep work windows are shrinking week after week, it usually points to growing delivery friction.
Microsoft’s 2025 data offers a clear example. PowerPoint edits spike by 122% in the final 10 minutes before meetings. That kind of last-minute preparation may look productive, but it often comes at the cost of focused execution earlier in the day.
3. Collaboration Overload
Collaboration is essential, but it becomes a problem when it starts replacing execution. If meetings increase, ad hoc requests keep coming in, and your team needs to work late just to complete core tasks, productivity is already under strain.
This is why predictive models in workforce productivity analytics need a more connected view. You have to evaluate meeting load, after-hours activity, and role-based focus time together. Looking at these metrics in isolation will not give you an accurate picture of how work is actually happening.
What Data Helps Forecast Productivity Risks?
If you want accurate employee productivity forecasting, you need to start with the right inputs. Attendance data alone will not get you there.
You need a broader set of signals that reflect how work is actually happening. That includes attendance consistency, active work patterns, focus time, task completion trends, meeting load, overtime, absenteeism, utilization, engagement pulse data, manager review signals, and team-level trend shifts. This is where many teams go wrong. If you rely on one or two narrow metrics, you end up tracking noise instead of real risk.
A more practical approach is to combine operational signals with people signals. When you look at them together, the patterns become clearer. Gallup’s 2025 global workplace data shows that only 21% of employees are engaged, while 62% are not engaged and 17% are actively disengaged. It also reports that 33% of employees are thriving, 58% are struggling, and 9% are suffering in terms of overall wellbeing.
When you connect this with your work-pattern data, the picture sharpens. If you see rising workload pressure, fragmented work patterns, or reduced focus time alongside weak engagement signals, the likelihood of a productivity dip increases significantly.
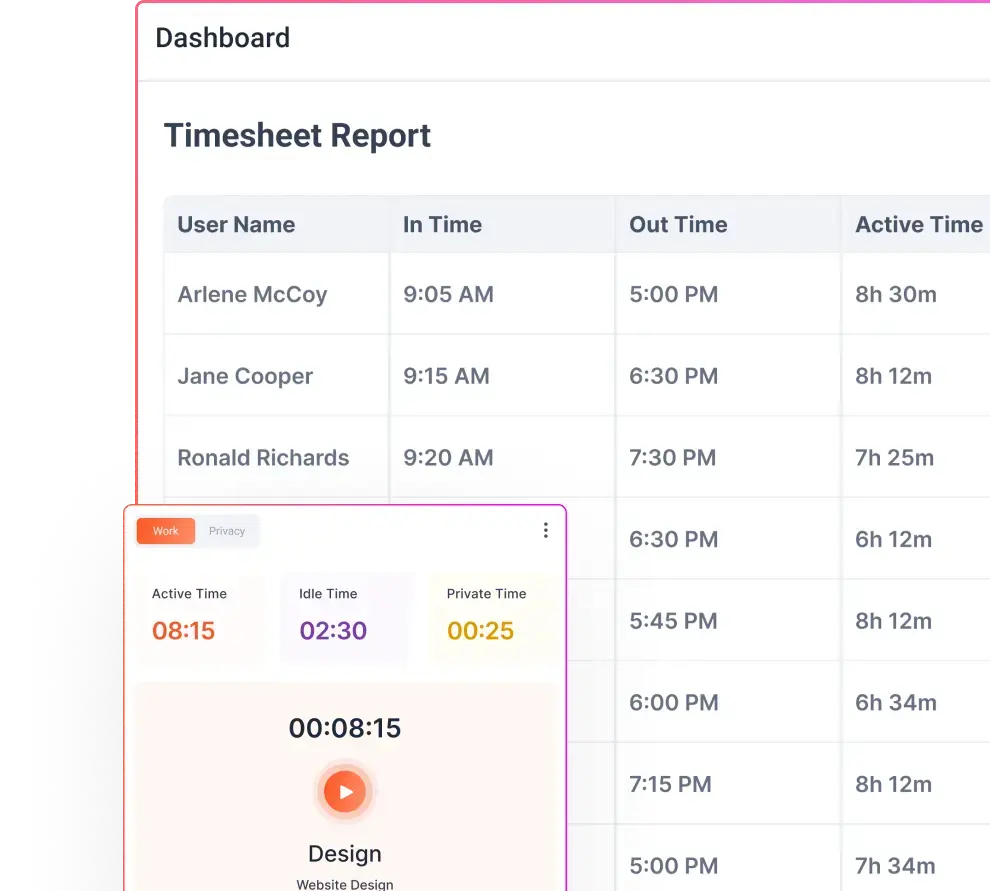
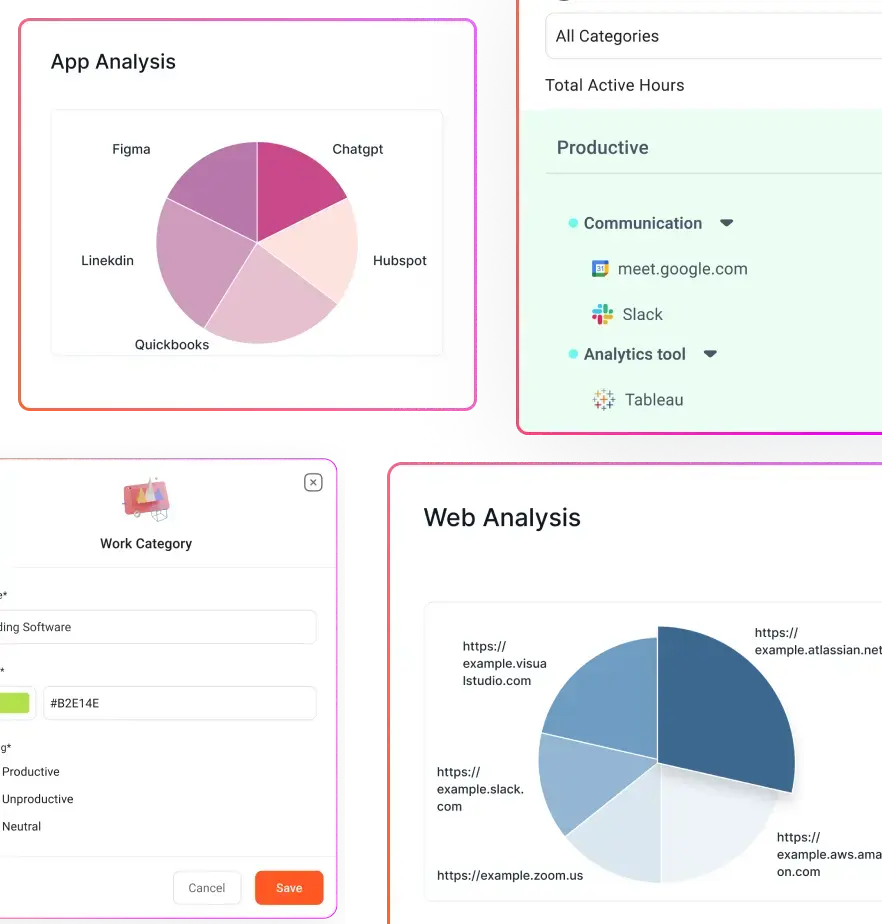
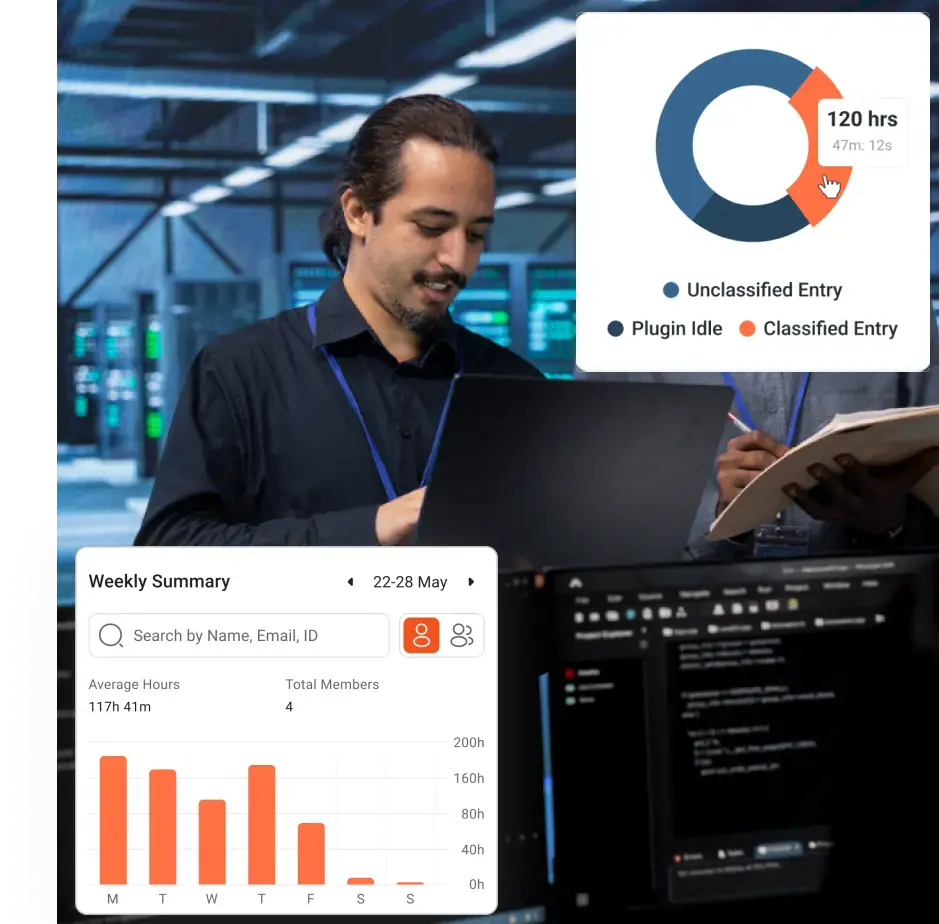
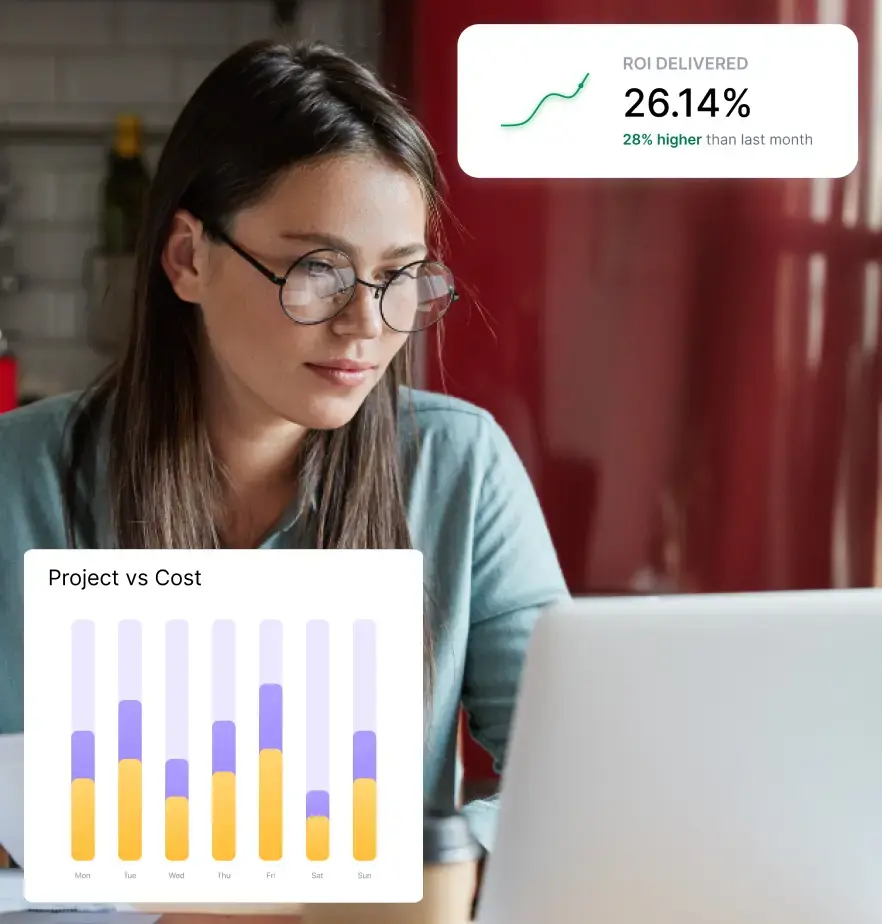
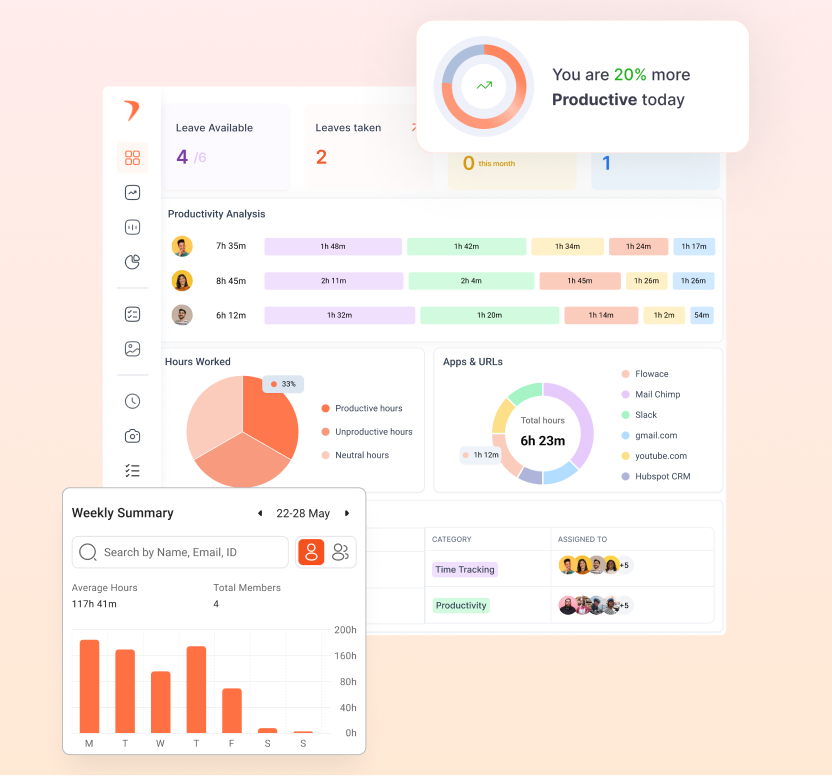
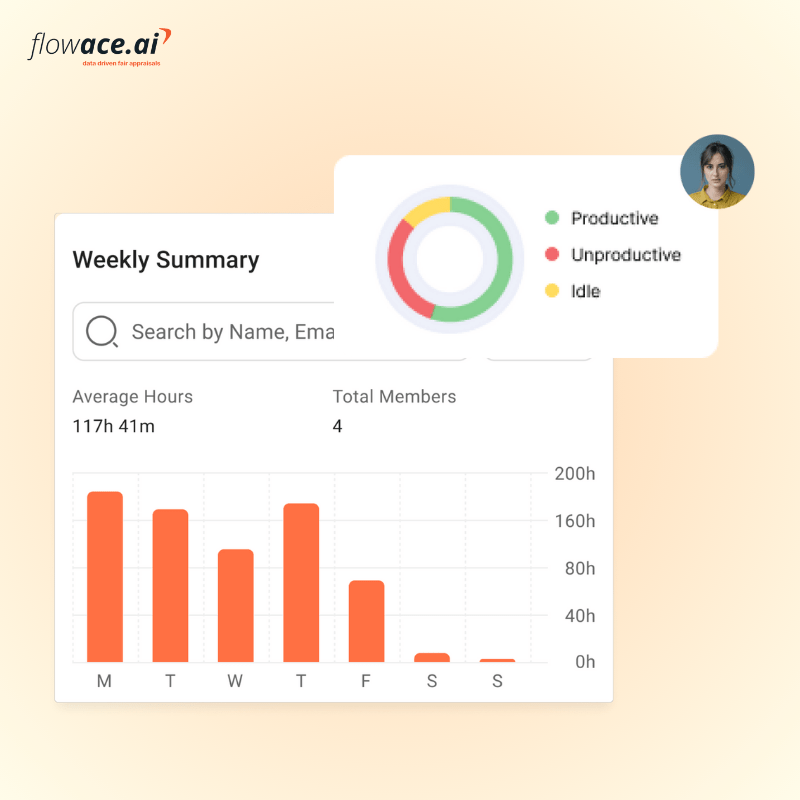
This is where a platform like Flowace fits into your workflow. It focuses on workforce analytics, AI-enabled time tracking, app and website tracking, productivity dashboards, alerts, attendance, and project visibility across remote, hybrid, and in-office teams. These are the day-to-day operating signals you need to make predictive analysis practical and actionable.
How Flowace Strengthens Productivity at the Workflow Level?
Flowace helps you move beyond broad productivity reports and see how work is actually flowing across your team each day.
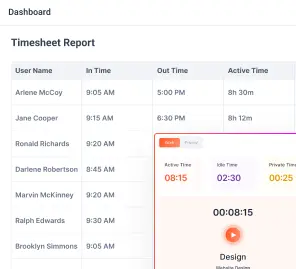
You can use Flowace to track active work patterns, app and website usage, automatic attendance, focus time, and project-level progress in one place. That gives you a clearer view of where productivity is holding steady and where it is starting to slip. Instead of waiting for delayed performance reviews or end-of-month reports, you can catch changes as they happen.
This matters because productivity problems usually start at the workflow level. A team may still be delivering, but the way work gets done may already be becoming inefficient. You may see more context switching, more fragmented time, more idle time between tasks, or more after-hours catch-up. Flowace helps you surface those patterns early so you can respond before they affect delivery.
It also gives managers a more practical way to coach teams. When you can see workload distribution, project visibility, and time spent across different tools and tasks, it becomes easier to spot overload, reassign work, and reduce friction. That means you are not just measuring productivity. You are actively improving how work gets done.
For remote, hybrid, and in-office teams, this workflow-level visibility is especially important. Different working models create different productivity risks, and you need a system that can reflect those differences without relying on guesswork. Flowace helps you connect the dots between effort, focus, collaboration, and output so you can make better decisions with less noise.
Final Thoughts
Predictive workforce analytics gives you a better way to manage productivity because it helps you act before problems become obvious. Instead of waiting for missed deadlines, burnout, or declining performance to show up in retrospective reports, you can watch for the early signals that tell you where work is starting to slow down.
The real advantage comes from combining historical data with current workflow signals. When you can see context switching, meeting load, focus time, attendance patterns, and team-level shifts in one view, you are in a much stronger position to protect output and reduce friction before it spreads.
That is where Flowace can help. It gives you the visibility you need to understand how work is happening across your team and the tools to improve it in real time. If you want to make productivity more predictable, start your free trial today or book a free demo with Flowace now.
FAQs
How is predictive workforce analytics different from traditional reporting?
Traditional reporting is descriptive. It tells you what has already happened. Predictive workforce analytics looks ahead. It helps you anticipate what is likely to happen so you can act earlier and prevent issues instead of reacting to them.
How can you forecast employee productivity?
You can forecast employee productivity by analyzing a combination of signals such as focus time, task completion trends, meeting load, app usage, attendance patterns, and engagement data. The key is to look at trends over time rather than isolated metrics.
What are the early signs of a productivity drop?
Some of the most common early signals include increased context switching, delayed start of meaningful work, shrinking focus time, rising meeting load, and more after-hours work. These patterns often appear before output starts to decline.
What is productivity debt?
Productivity debt refers to the hidden cost of inefficient work patterns such as excessive meetings, constant interruptions, and coordination overload. Over time, this builds up and leads to slower delivery, lower quality, and team fatigue.
What data is needed for accurate productivity forecasting?
You need a mix of operational and people data. This includes attendance consistency, active work patterns, focus time, task completion, meeting load, overtime, absenteeism, utilization, engagement scores, and team-level trends.
How does Flowace support predictive workforce analytics?
Flowace provides visibility into day-to-day work patterns through features like time tracking, app and website usage, productivity dashboards, attendance tracking, and project insights. These signals help you identify productivity risks early and take action to improve workflow efficiency.