Key Takeaways:
- Hours logged measure presence, not productivity
- Employees can appear busy but still do low-value or fragmented work
- Activity-Based Utilization (ABU) tracks time spent on meaningful work
- ABU fills the gap between hours (input) and outcomes (output)
- Reveals hidden issues like context switching, meeting overload, and idle time
- Helps identify overutilization, underutilization, and burnout risks
- Enables role-based productivity benchmarks (fairer than one standard)
- Acts as a leading indicator for performance and workload issues
- Should be used alongside output metrics, not as a replacement
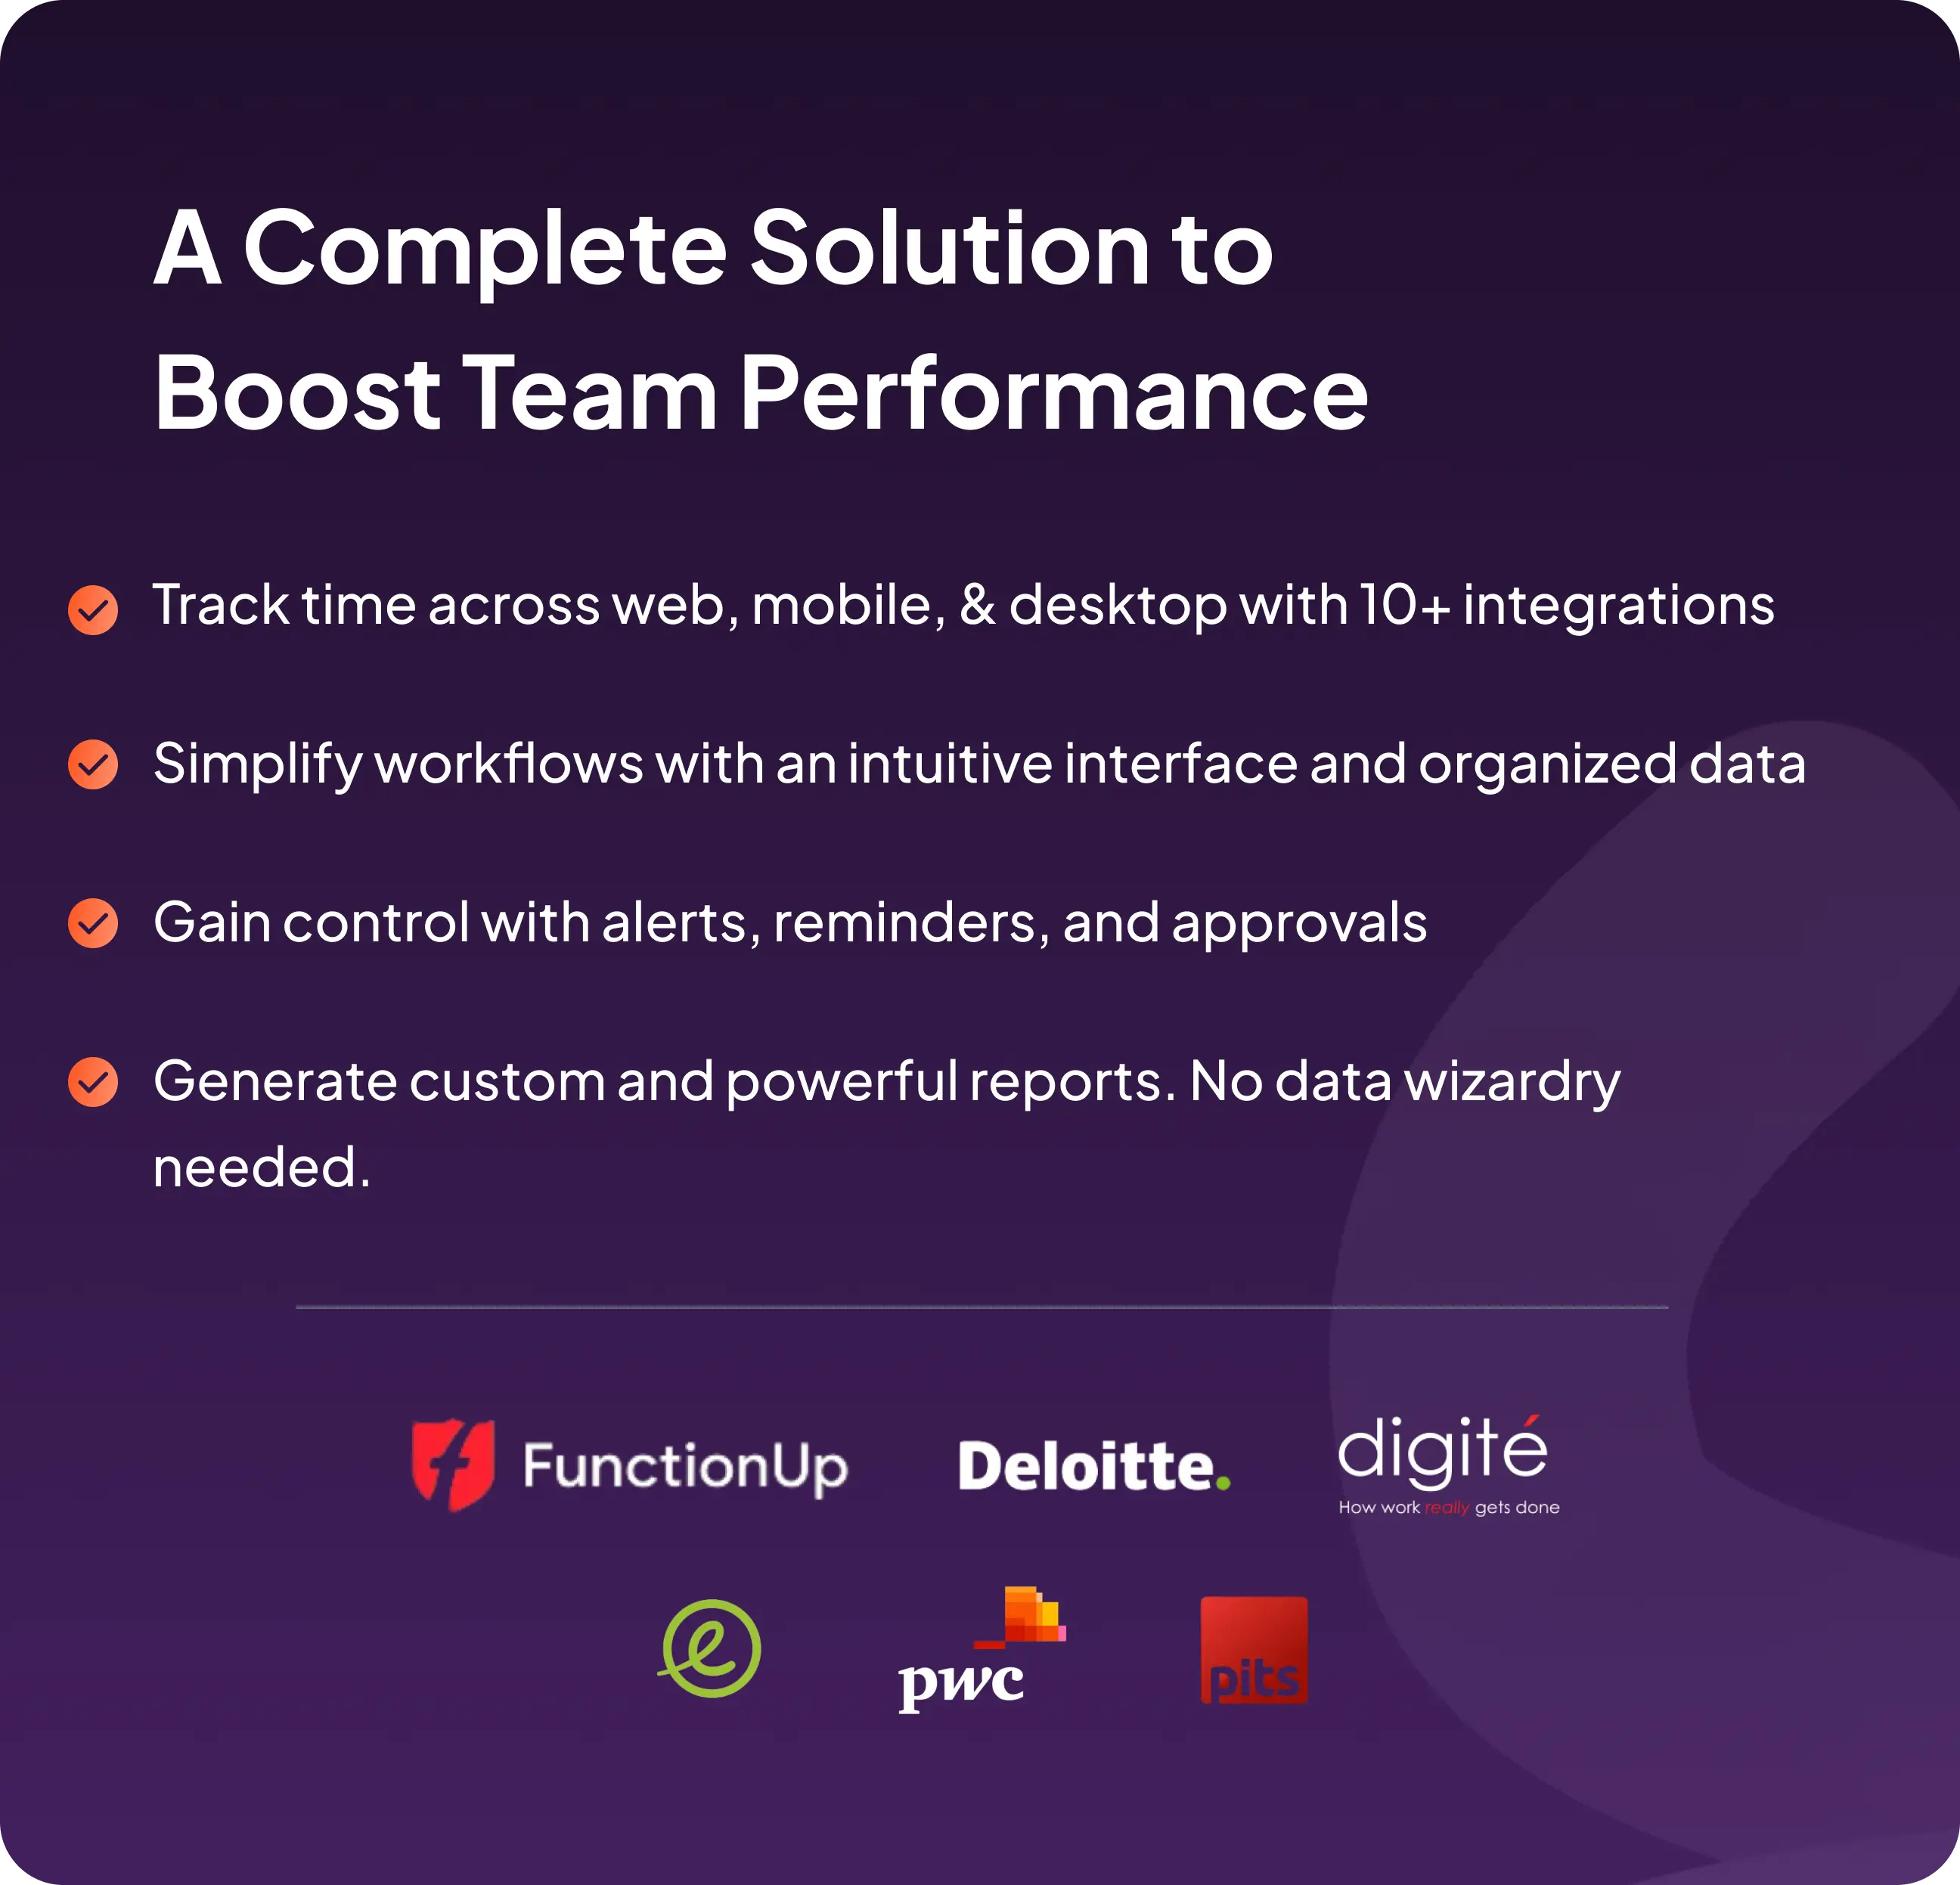
- Tools like Flowace make ABU practical with automatic tracking and insight.
In the U.S., 53 percent of remote‑capable employees are working a hybrid schedule in 2026, 27 percent are fully remote and only 20 percent are on‑site. That means most managers now oversee distributed teams. While remote work offers flexibility, it also makes it harder to judge whether people are working effectively.
Hours logged—the time someone is online or clocked in—has long been used as a proxy for productivity, but it only tells part of the story.
The stronger metric is activity‑based utilization—a way of measuring how much of a person’s available work time is spent on meaningful, value‑adding tasks instead of simply counting total logged hours.
In this article, you’ll learn why hours logged is a poor gauge for remote work, what activity‑based utilization measures are, how to calculate them, and how a tool like Flowace can help you move beyond basic time totals.
Why “Hours Logged” Is a Weak Utilization Metric for Remote Teams
Hours logged is one of the most commonly used metrics to measure productivity—but for remote teams, it often tells the wrong story.

Hours Logged Measure Duration, Not Work Quality
Clocking eight hours says nothing about whether those hours involved deep work, shallow administrative tasks or distractions. In 2025, Microsoft’s Work Trend Index found that employees using Microsoft 365 are interrupted every two minutes by emails, chats or meetings, and nearly half of workers said their work felt chaotic and fragmented. Logging time doesn’t reveal how those interruptions cut into focus.
A Full Day Can Still Be A Poorly Utilized Day
Remote workers often look busy but can lose hours to context switching. It’s easy to log eight hours while spending most of that time in meetings or switching between apps.
A person may be active all day, yet still make little real progress because their attention is repeatedly broken into small fragments. That means eight logged hours can easily turn into a day of reacting, checking, replying, and moving between tasks instead of doing focused, high-value work. From the outside, the time looks productive. In reality, much of it may be spent recovering focus, catching up, and trying to get back on track.
Why Remote Work Makes This Problem Worse
Distributed teams rely heavily on digital communication. That leads to more notifications, more meetings across time zones and more after‑hours work. Microsoft’s WorkLab shows that nearly 30 percent of workers send or receive messages after 10 p.m.. Eptura’s 2025 research adds that employees are interrupted every three minutes and take about 23 minutes to regain focus.
When presence is measured by hours alone, these interruptions remain invisible. Remote managers may assume someone is slacking when they’re simply stuck in reactive work.
What Activity‑Based Utilization Actually Measures
Activity‑based utilization (ABU) measures the proportion of available work time that is spent on meaningful, work‑related activity. “Meaningful” work includes focused project work, collaboration, customer interactions and planned administration.
It excludes idle time, prolonged context switching and non‑work activities. The goal is to understand how time is used, not just how much time is logged.
Presence vs Activity vs Output
Work can be understood in three stages:
- Presence – when someone is logged in or officially “on the clock.” Hours logged tracks this layer.
- Activity – how that time is distributed across tasks, apps, projects and contexts. Activity‑based utilization lives here.
- Output – the tangible work delivered, such as code shipped, support tickets resolved or sales closed.
Hours logged measure only the first layer, while performance reviews often focus only on the third. Activity‑based utilization fills the gap by capturing the middle layer and providing earlier signals when workloads are misaligned or focus is dropping. Without it, managers have little insight into whether time is being spent productively or wasted on unnecessary meetings.
Why Activity Is The Missing Middle Layer
Outcomes such as revenue or deliverables are lagging indicators. They surface problems after it’s too late to course‑correct. Hours logged, on the other hand, are a blunt leading indicator that ignores quality.
Activity‑based utilization provides leading, context‑rich signals about how time is actually being used, allowing managers to adjust workloads, redistribute tasks and provide coaching before projects run off track. It helps remote teams maintain momentum and wellbeing.
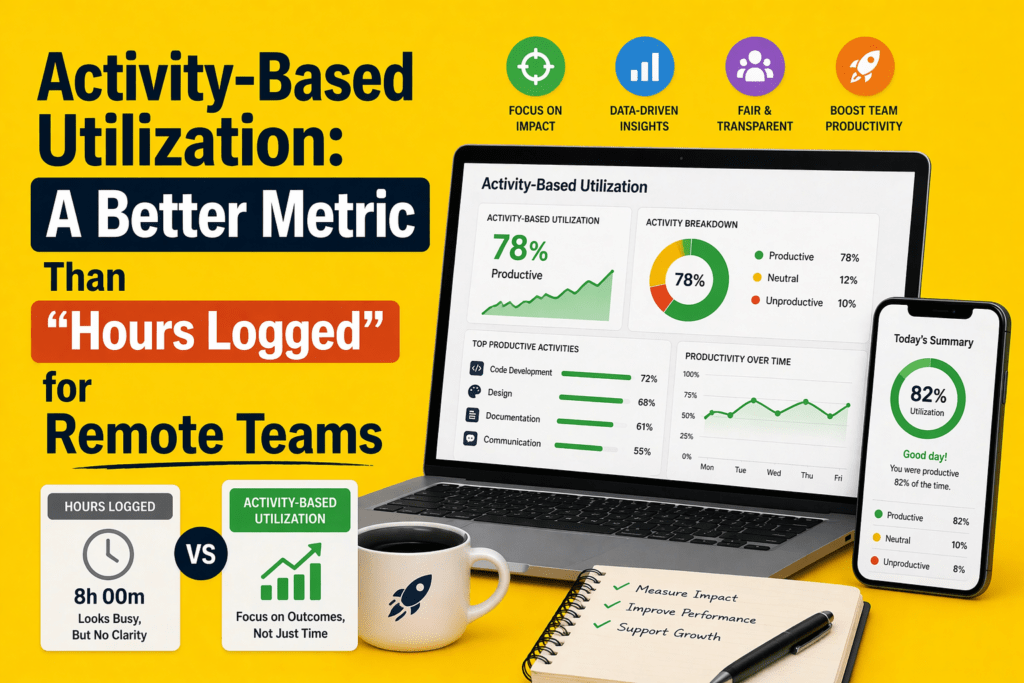
Activity‑Based Utilization vs Hours Logged: What’s the Difference?
Here is a concise comparison between the two metrics. Notice how activity‑based utilization incorporates context and fairness.
| Metric | Hours logged | Activity-based utilization |
| What it measures | Total time someone is online or clocked in | Percentage of available time spent on meaningful work |
| Context level | Low – counts duration only | High – includes app usage, focus vs meetings, project alignment |
| Reveals fragmentation | No – hides meeting overload and task switching | Yes – shows when days are filled with reactive work |
| Fair across roles | Weak – assumes all roles need the same hours | Better – adjusts targets by role and task mix |
| Helps workload planning | Limited – can misidentify high hours as productivity | Strong – highlights overload, underuse, and burnout risk |
Why This Difference Matters For Remote Team Management
Relying on hours logged can lead to unfair judgments and flawed planning. For example, developers who spend more time thinking and less time typing may appear “underutilized” compared to support staff constantly on calls. Activity‑based utilization considers the nature of work and surfaces patterns like meeting overload or excessive context switching that limit output. Managers can then balance workloads, remove blockers and set realistic expectations.
The Biggest Blind Spot in Remote Work: Fragmented Utilization
Fragmented utilization describes a workday filled with micro‑tasks, context switching and meetings that leave little room for deep work. Signs include:
- Long days with surprisingly little progress on core deliverables.
- Calendars packed with meetings, many of which are unplanned or last‑minute.
- Constant switching between apps, emails and chat threads, causing cognitive drag.
- Reactive communication replacing focused execution.
- High idle time punctuated by bursts of activity.
Why Fragmented Days Look Productive On Paper
Because employees are online and active, the time tracking systems show a full day. Hours logged do not differentiate between attending a back‑to‑back series of meetings and writing a report. Ad hoc calls and unscheduled meetings create the illusion of collaboration, yet often waste time. Without activity context, managers might praise a team for “putting in the hours” even as projects fall behind.
How Fragmented Utilization Hurts Teams
Fragmented days slow down project delivery, increase errors and contribute to burnout. CoworkingCafe’s 2026 well‑being survey reports that 33 percent of remote and hybrid workers experienced burnout symptoms such as emotional exhaustion and motivation dips. When deep work is continuously interrupted, employees may end up working longer hours to catch up, leading to the “always‑on” pressure felt by 58 percent of remote workers.
What Signals Create a Better Utilization Metric?
Activity‑based utilization relies on multiple signals to provide context and fairness:
Active time vs idle time
Active time measures when an employee is engaged with work apps, tools or tasks. Idle time marks periods of inactivity or non‑work activities. A good ABU model flags prolonged idle time and clusters of micro‑interruptions so managers can remove blockers or adjust workloads.
Focus time vs coordination time
Focus time is time spent on deep, uninterrupted tasks such as coding, writing or strategic planning. Coordination time includes meetings, emails and chats. Tracking focus versus coordination helps identify when meetings are consuming too much of the day.
App and website usage patterns
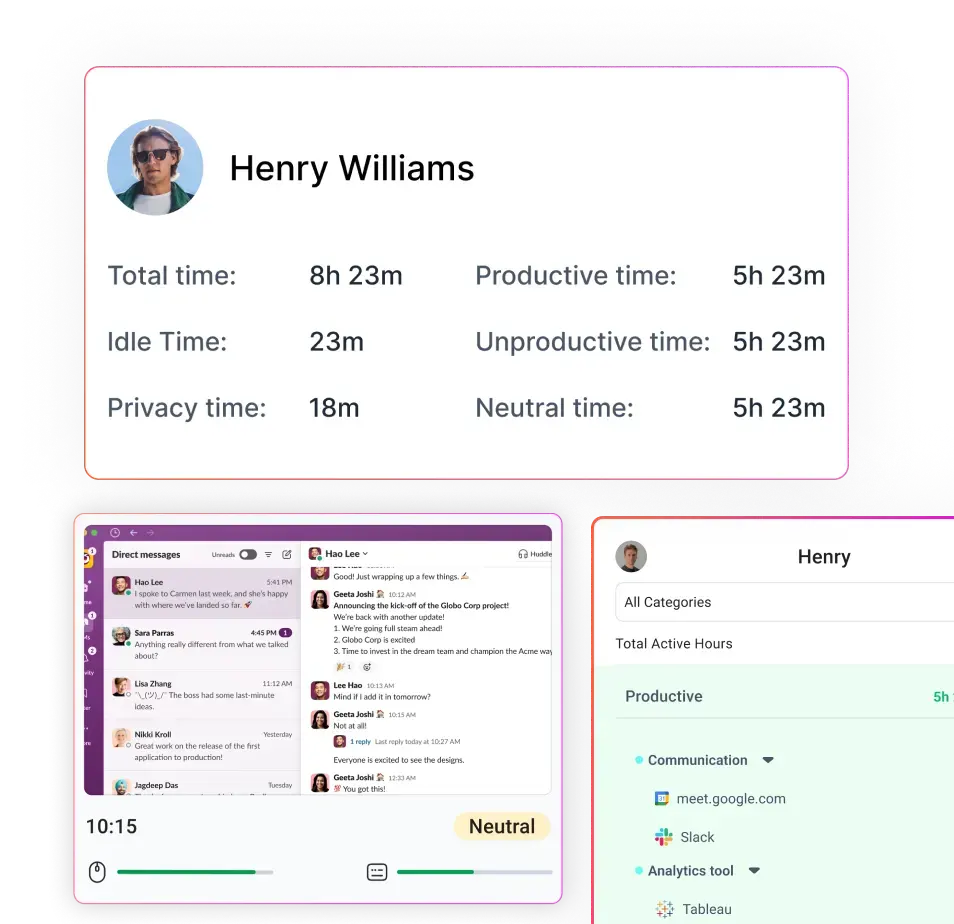
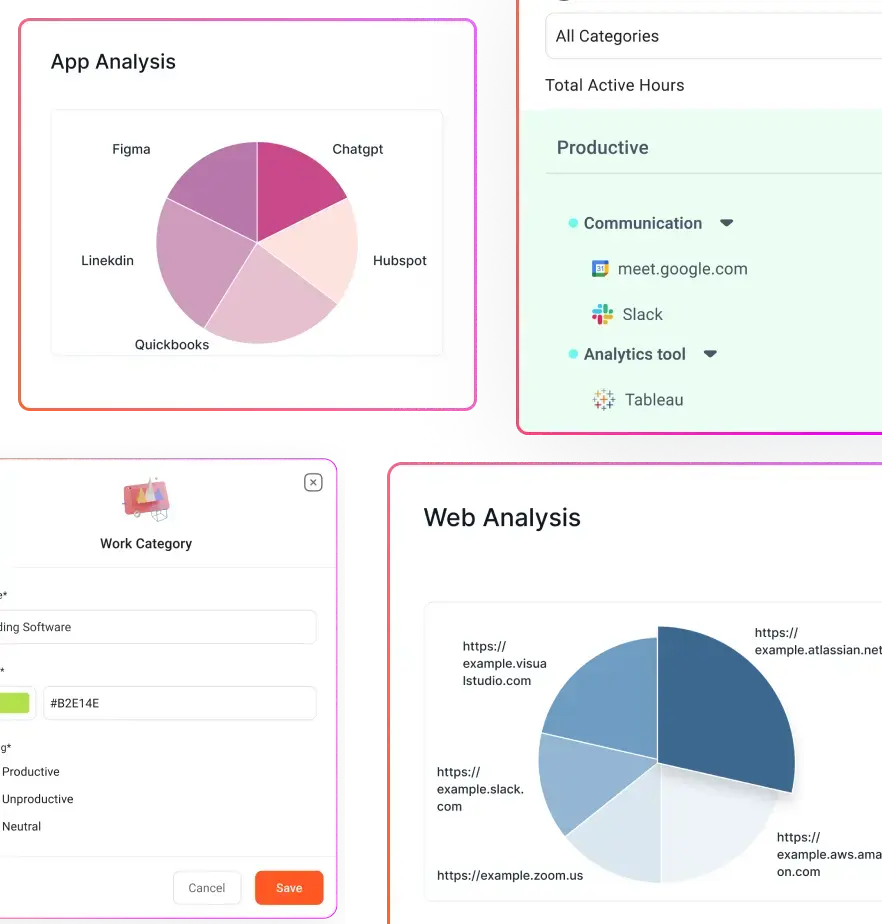
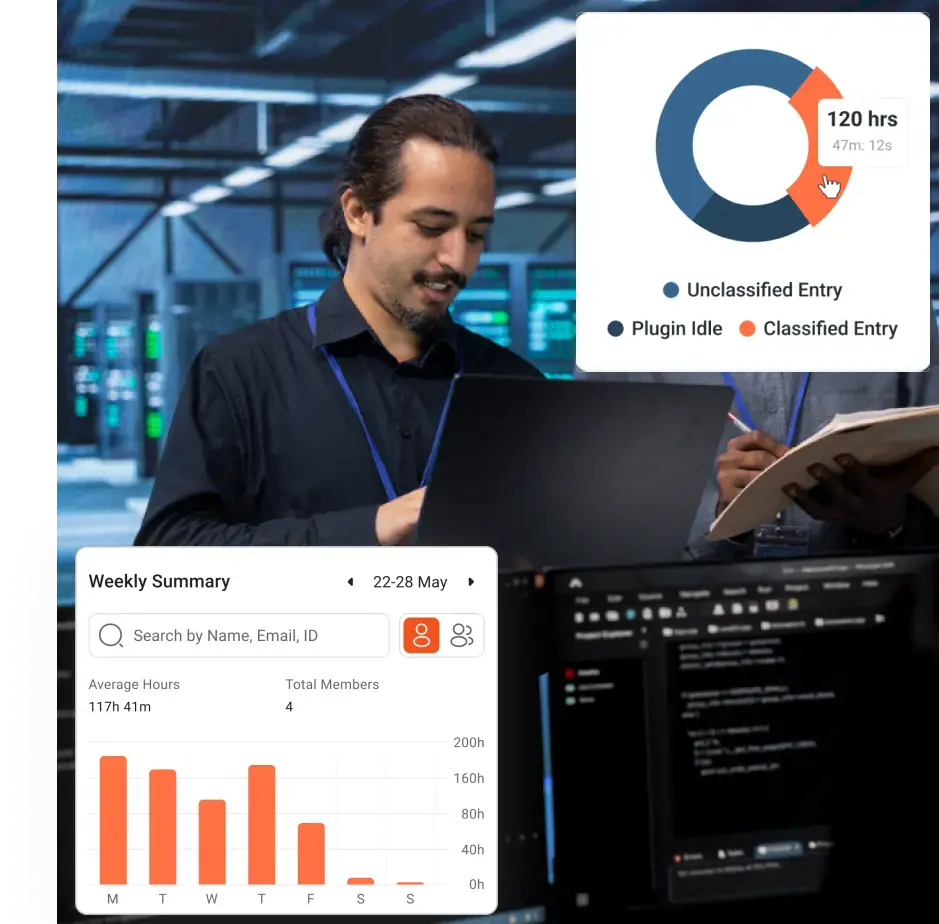
Different tools have different productivity values. For example, design software or IDEs may be considered productive, while social media or entertainment sites may not. Monitoring application usage (without intrusive surveillance) helps distinguish productive work from distractions. At Flowace, apps and websites are automatically categorized into productive, neutral and unproductive classes to give managers and employees a clear picture of where time goes.
Project‑linked activity and task alignment
Measuring how much time is spent on specific projects or tasks helps ensure work aligns with priorities. If an employee spends 50 percent of their time on low‑priority administrative tasks, ABU highlights the mismatch. Flowace’s project and task tracking features link time logs to specific tasks so leaders can see whether resources are focused on revenue‑generating activities or admin work.
Workload consistency over time
Consistency matters. Sporadic spikes of high activity followed by long idle periods may signal poor planning or employee burnout. Tracking utilization trends over weeks and months helps identify individuals at risk of under‑ or over‑utilization. Regular patterns indicate that tasks and workloads are balanced; erratic patterns require investigation.
Why Role‑Adjusted Utilization Is More Fair Than One Blanket Standard
Not all work follows the same rhythm, so measuring everyone against a single utilization benchmark creates more distortion than clarity. What “productive” looks like varies by role, task type, and team expectations.
Different roles use time differently
Developers need long stretches of focus. Recruiters spend hours on calls and interviews. Sales representatives juggle client meetings, CRM updates, and prospecting. Operations managers coordinate schedules and handle administrative work. Each role has a unique mix of activities and ideal utilization bands. These differences highlight why a one‑size‑fits‑all utilization target is unrealistic.
Why one utilization benchmark fails across departments
A support agent may need to be available 85–90 percent of the day, whereas a strategist may produce the best work at 60 percent utilization with long focus blocks. Setting a single target encourages unhealthy comparisons and can push employees toward performative busyness.
ABU allows departments to define meaningful activities for their roles. Flowace, for example, categorizes apps and tasks based on team norms and allows managers to set different productivity baselines for developers, designers, finance staff, or sales teams.
How role‑based activity patterns create better benchmarks
Role‑adjusted benchmarks encourage fairness and accuracy. They prevent a designer from being penalized for spending time on research or brainstorming and recognize that a customer support agent’s productivity is measured by call resolution, not lines of code written.
Activity‑based utilization uses historical data to establish realistic expectations and reveals when someone is underutilized or overloaded relative to peers in similar roles.
A Simple Formula for Activity‑Based Utilization
You can use an employee utilization rate calculator to understand how much time is truly spent on meaningful work versus low-value tasks. The following formula provides a starting point for measuring ABU:
Activity‑Based Utilization (%) = (Meaningful Active Work Time ÷ Available Work Time) × 100
Meaningful active work time includes time spent on tasks that advance goals—coding, design, calls with clients, strategic planning, problem solving, etc.—and excludes idle time, breaks and non‑work activities. Available work time is the total scheduled time minus break entitlements and leave.
What counts as meaningful active work
Meaningful work depends on role context. For a salesperson, calls and CRM updates are meaningful; for a developer, hours spent coding or debugging are; for an HR manager, recruiting and employee support tasks qualify. Planning sessions, learning and documentation may also count. The key is to define which activities contribute directly to business goals and categorize app usage accordingly. Flowace uses machine learning to classify apps and websites into productive, neutral and unproductive categories.
Why role context matters in the formula
Two employees could spend identical time on the same tool but have different utilization scores if their roles treat that activity differently. For example, time spent on Slack may be productive for a support team but distracting for a developer. Role context ensures the ABU score aligns with job expectations. A flexible system like Flowace lets you adjust classifications and thresholds by team.
What this metric can and cannot tell you
Activity‑based utilization is a leading indicator of how time is being used. It highlights overload, under‑engagement and fragmentation. However, it does not replace outcome metrics like sales closed or projects delivered.
A low ABU score should prompt managers to investigate (not punish) because the cause might be misaligned priorities, process issues, or personal challenges. Similarly, a high ABU score does not guarantee quality work if tasks are misdirected. Use ABU alongside qualitative feedback and output metrics.
How Flowace Helps Remote Teams Measure Utilization More Accurately
Flowace is an AI‑powered time tracking and productivity platform that helps companies move from hours logged to activity‑based utilization without micromanaging. Here’s how it aligns with the signals and frameworks discussed above:
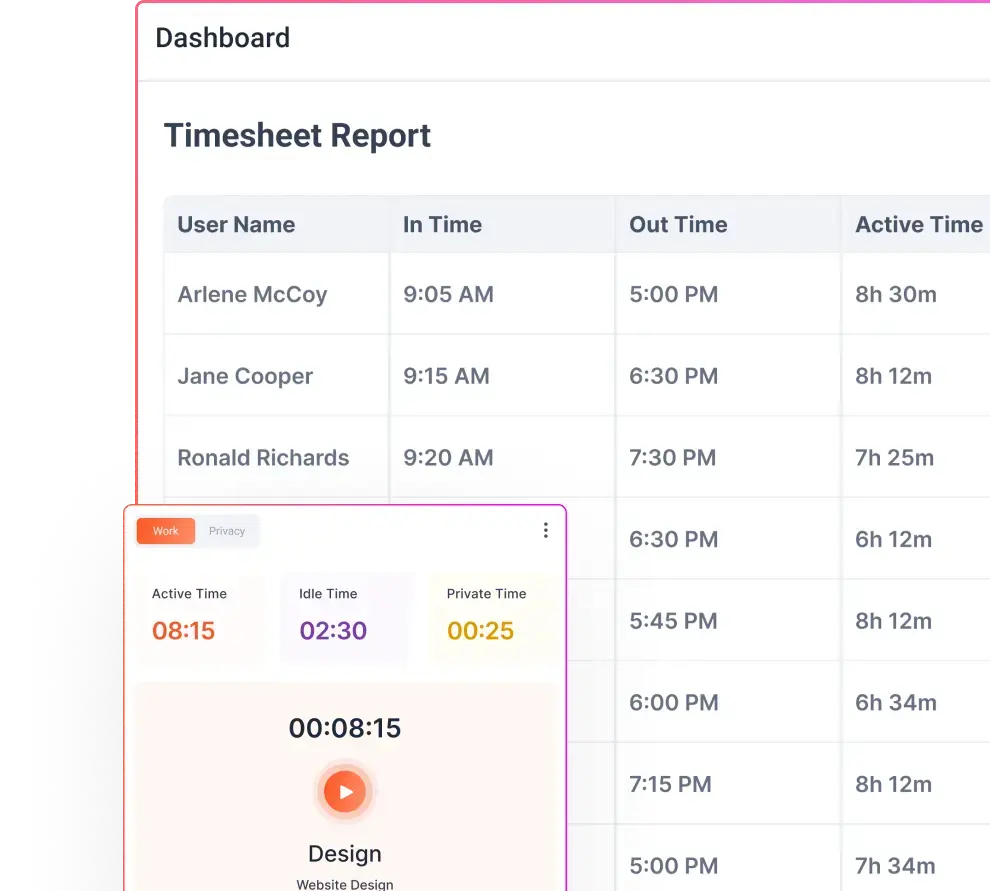
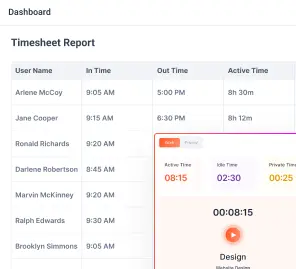
Automatic time tracking beyond manual timesheets
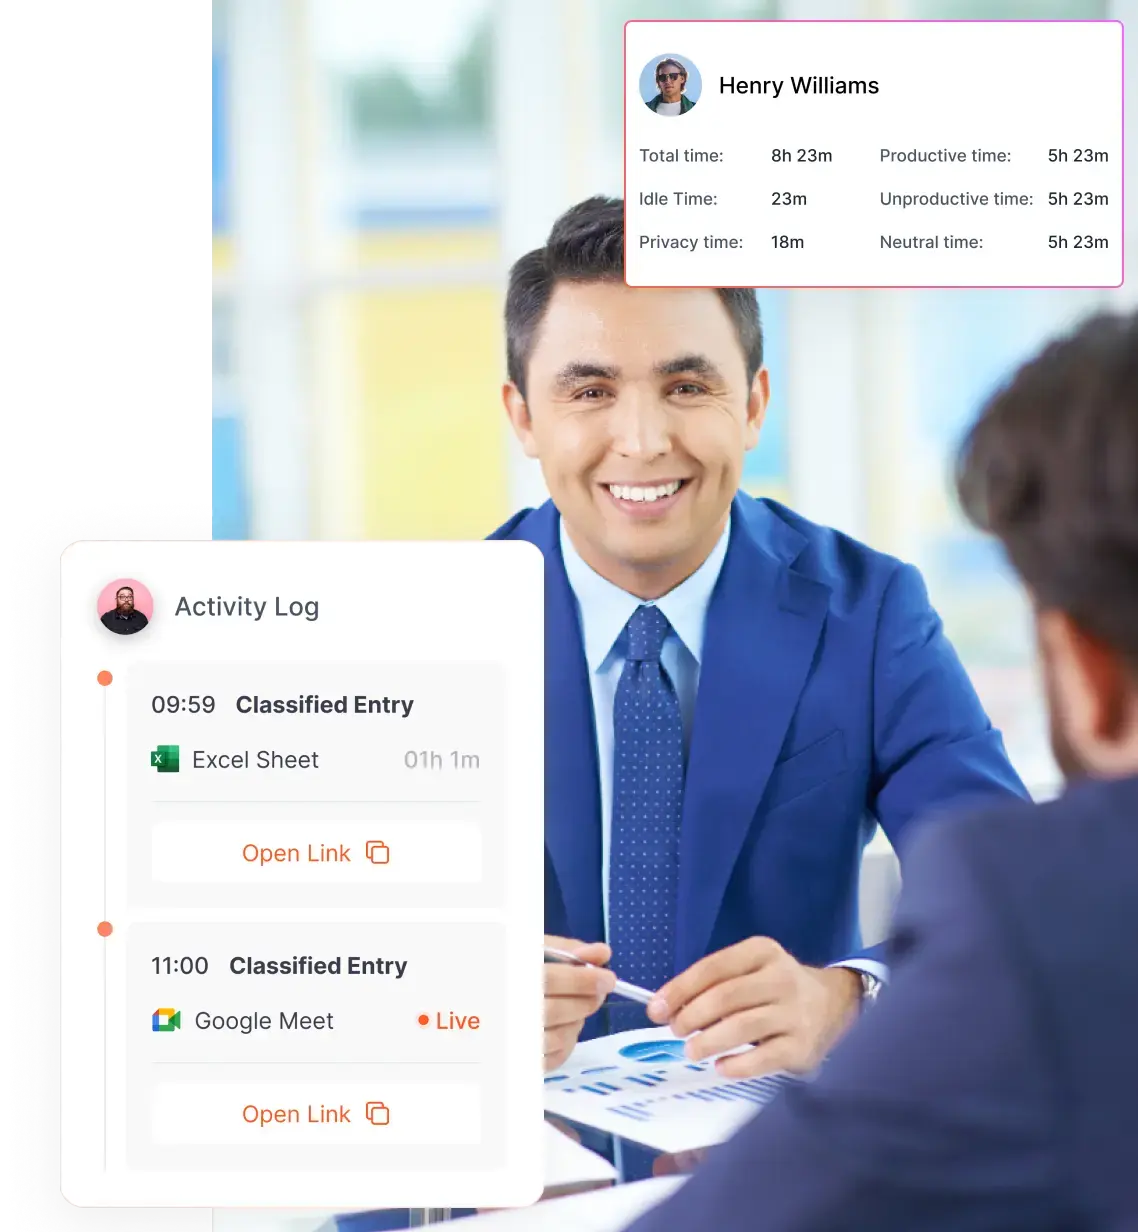
Flowace captures work activity automatically, eliminating the need for start‑stop timers. It records app usage, project and task activity and can categorize time into productive, neutral and unproductive buckets. This hands‑free approach ensures high‑resolution data without disrupting workflows.
App and website usage visibility for better work context
The platform monitors which apps and websites employees use, classifying them by productivity impact. Leaders can customize categories for different teams—so design tools are marked productive for designers, while social media might be neutral or unproductive. This helps teams see where time goes and adjust habits.
Active, idle and focus patterns that reveal time quality
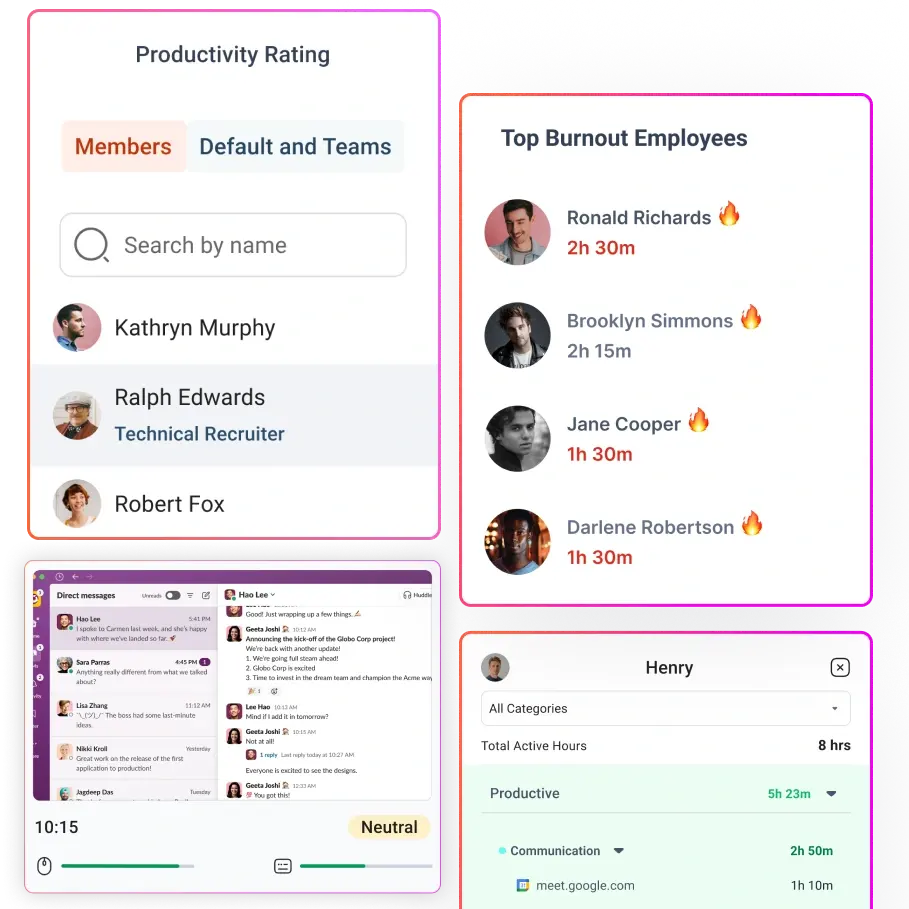
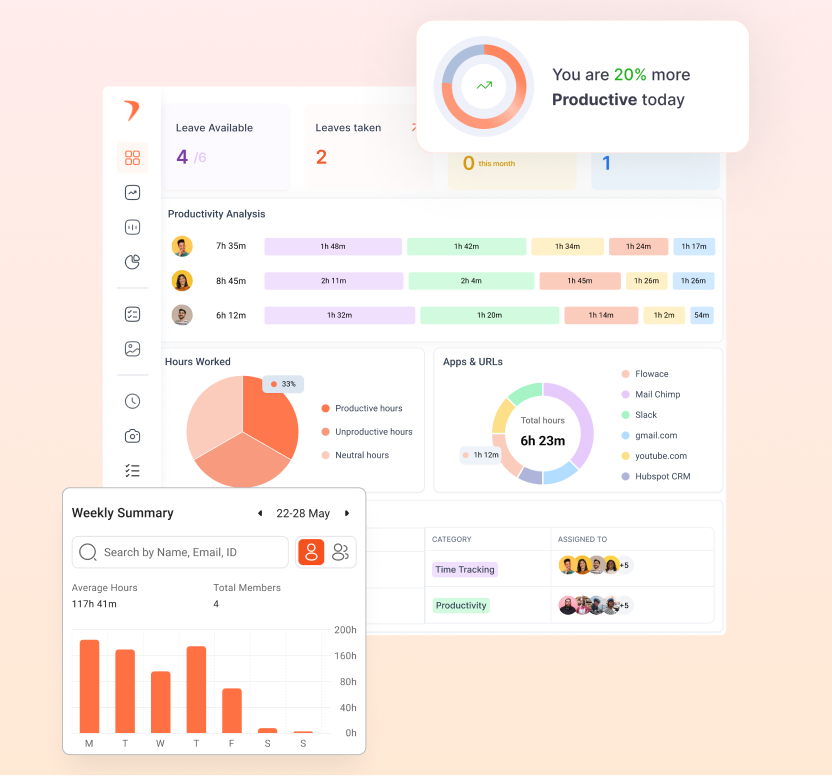
Flowace tracks active versus idle time and distinguishes focus sessions from meeting time. By reviewing these patterns, managers can spot fragmentation, schedule fewer ad hoc calls and support employees in carving out longer focus blocks. The tool provides dashboards showing productivity scores and burnout alerts when utilization stays high for too long.
Role‑based productivity views for fairer interpretation
Users and managers can set different productivity baselines for each role. Flowace’s “privacy mode” allows employees to turn off detailed tracking when working on sensitive tasks, balancing monitoring with autonomy. By customizing thresholds and categories, teams can avoid punishing someone for spending time on research or planning.
Workload visibility for capacity planning and coaching
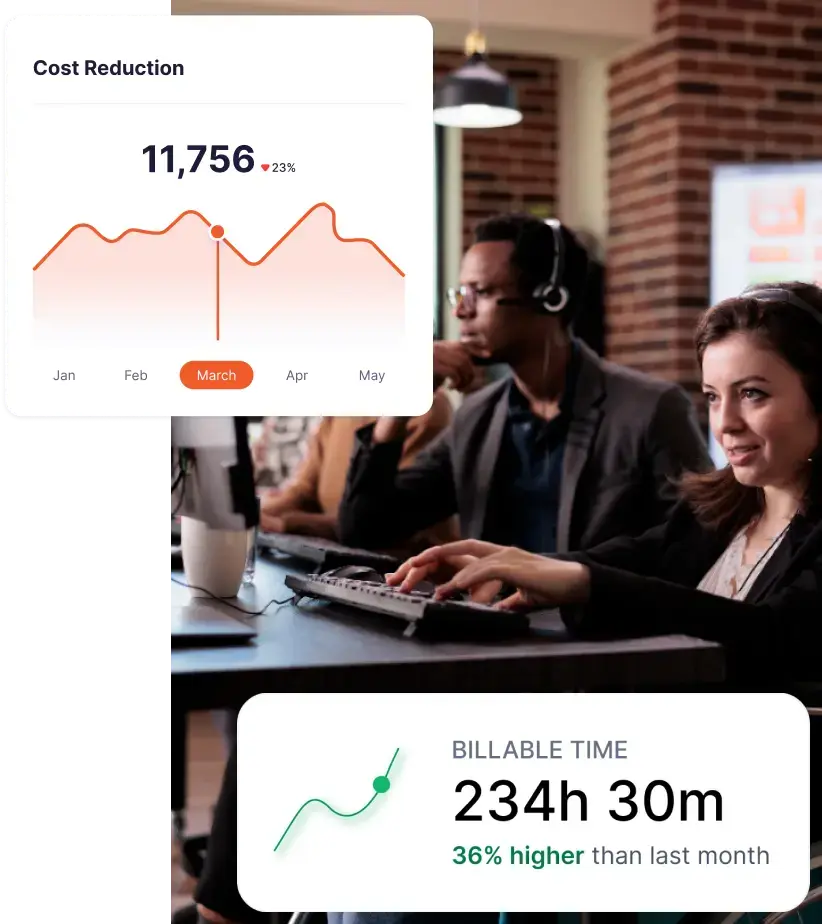
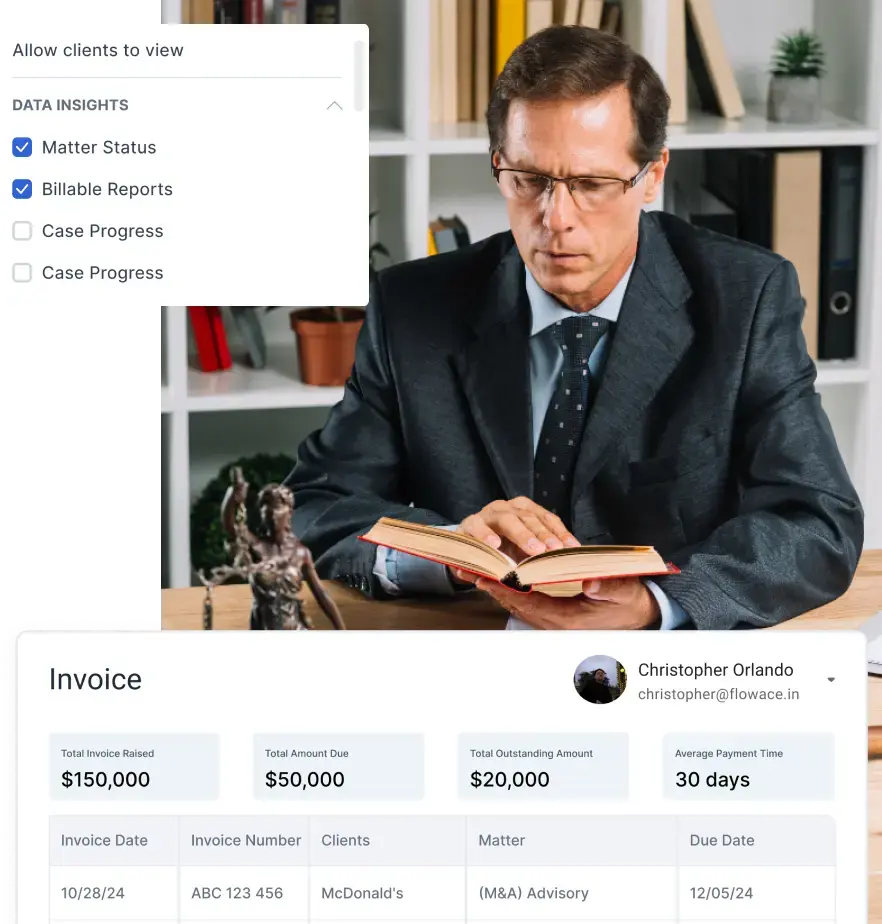
Flowace aggregates utilization data at the team and organization level. Managers can see who is overloaded, underutilized or consistently working outside business hours. This insight supports fair coaching conversations and helps avoid burnout. Finance teams can sync time logs with payroll and billing systems for accurate invoicing.
Flowace offers three pricing tiers.
- The Basic plan (≈$2.99 per user per month) provides automatic tracking, silent monitoring, attendance, projects and tasks and basic productivity scoring.
- The Standard plan (≈$4.99 per user per month) adds app and website tracking, productivity ratings, and integrations.
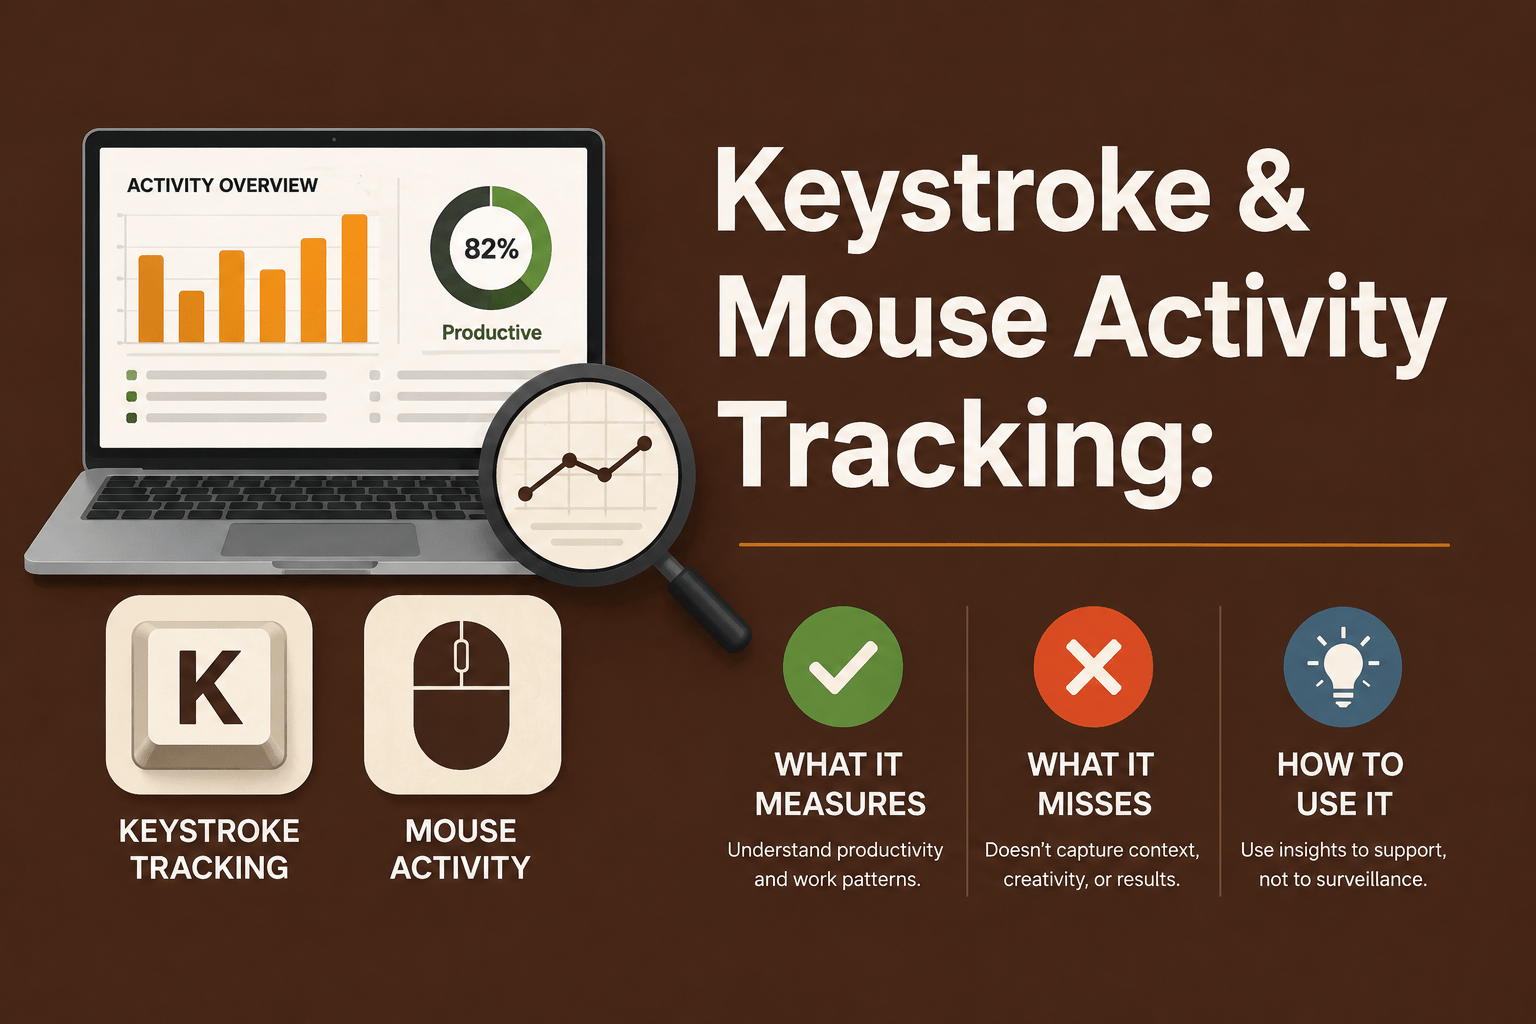
- The Premium plan (≈$10 per user per month) includes keyboard/mouse activity, billing and invoicing features, client logins and executive dashboards. A seven‑day free trial lets teams test the system before committing.
Final Takeaway
Traditional time tracking is useful for payroll and compliance, but it fails as a modern productivity metric for remote teams. Ultimately, activity‑based utilization equips teams to deliver more value. It captures the distribution of time across meaningful work, meetings, coordination and idle moments. It allows managers to see fragmentation, adjust workloads by role and coach fairly.
Tools like Flowace make it easy to implement ABU by automatically tracking time, classifying apps, identifying focus patterns and respecting privacy. For leaders who want to maximize remote team utilization without micromanaging, shifting the question from “How long were you online?” to “How was your time used?” is the first step.
Ready to see your team’s true utilization? Flowace helps you go beyond time totals with automatic tracking, app and website insights and role‑based productivity views. Start with a free trial or book a demo to explore how activity‑based utilization can improve your remote team’s performance.
FAQs:
Q1. What is activity‑based utilization?
Activity‑based utilization is the proportion of available work time that an employee spends on meaningful, value‑adding tasks. It includes focused project work, collaboration and planned administration but excludes idle time and distractions. The goal is to understand how time is used rather than just how long someone is online.
Q2. How is activity‑based utilization calculated?
You calculate activity‑based utilization by dividing meaningful active work time by available work time and multiplying by 100. Meaningful time includes tasks that directly support business goals, such as coding, client calls or strategic planning. Available time excludes breaks and leave.
Q3. Why are hours logged insufficient for remote teams?
Hours logged measure presence, not work quality. Research shows remote workers are interrupted every two minutes, and half of meetings are ad hoc. A full day can still be wasted on low‑value tasks or reactive communication. Hours logged don’t reveal fragmentation, focus time or role differences, leading to unfair judgments.
Q4. What are the benefits of using activity‑based utilization?
Activity‑based utilization provides earlier, more actionable signals for workload planning, capacity decisions and coaching. It helps identify when employees are overworked or underutilized, reveals hidden fragmentation and allows managers to tailor benchmarks by role. Studies show well‑organized hybrid teams achieve up to five percent higher productivity than fully in‑office teams.
Q5. How does Flowace support activity‑based utilization?
Flowace automatically tracks time across apps, websites, projects and tasks. It classifies activity into productive, neutral and unproductive categories, distinguishes focus sessions from coordination, and provides dashboards showing active, idle and burned‑out patterns. Role‑based productivity views let you set different baselines for developers, support agents or managers, enabling fair and accurate utilization insights. Pricing starts around $2.99 per user per month, with higher tiers adding advanced features like billing and invoicing.