Key Takeaways:
- Distractions are often invisible but costly: Employees can lose 1–2 hours per day to non-work internet use without it showing up in performance metrics.
- Productivity killers are role-dependent: What’s distracting for one role may be productive for another. E.g., social media may be useful for marketers but not for engineers.
- Establish a baseline first: Measure current performance using time-tracking, output metrics, and other data sources before implementing changes.
- Use reliable data sources: Tools like Flowace along with project management logs and output metrics, give accurate insights.
- Watch for key signals: High unproductive time, frequent context switching, idle bursts, sudden spikes, or declining outcomes indicate areas needing attention
- Classify apps and websites by role: Categorize tools as productive, neutral, or unproductive based on whether they directly support core work tasks.
- Configure per department: Tailor app and website classifications for each team (engineering, marketing, sales) to reflect actual work patterns.
- Set practical thresholds: Examples include ≥15% team unproductive time or ≥25% individual unproductive time as triggers for review.
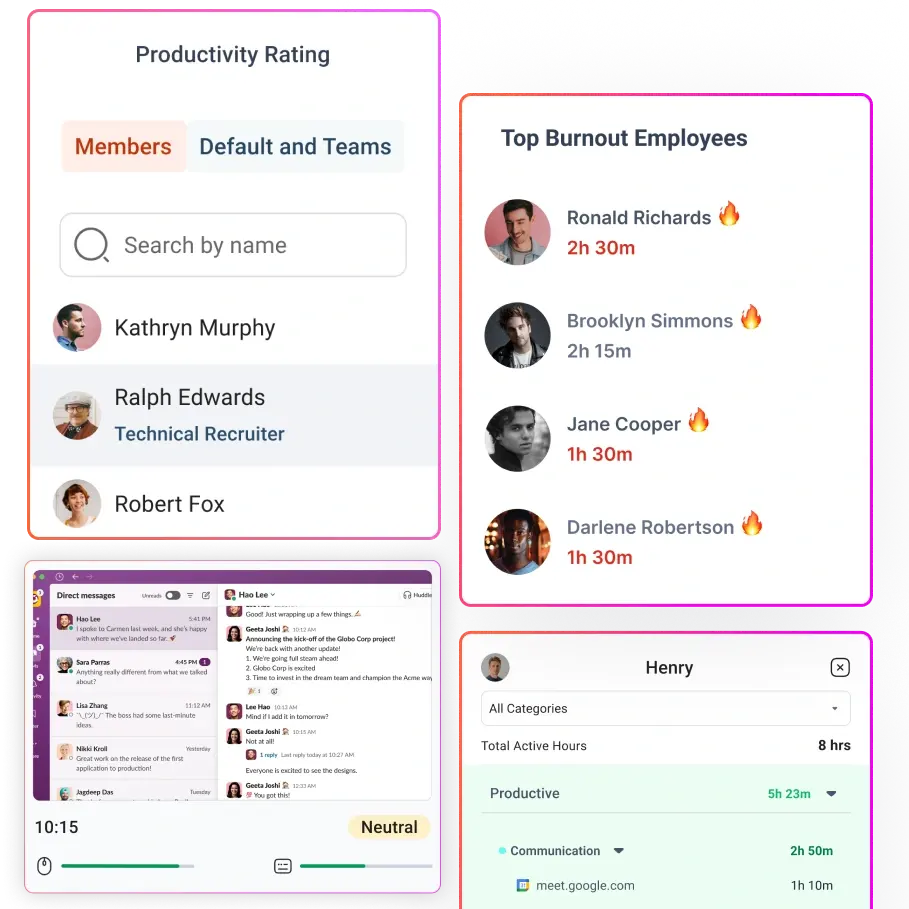
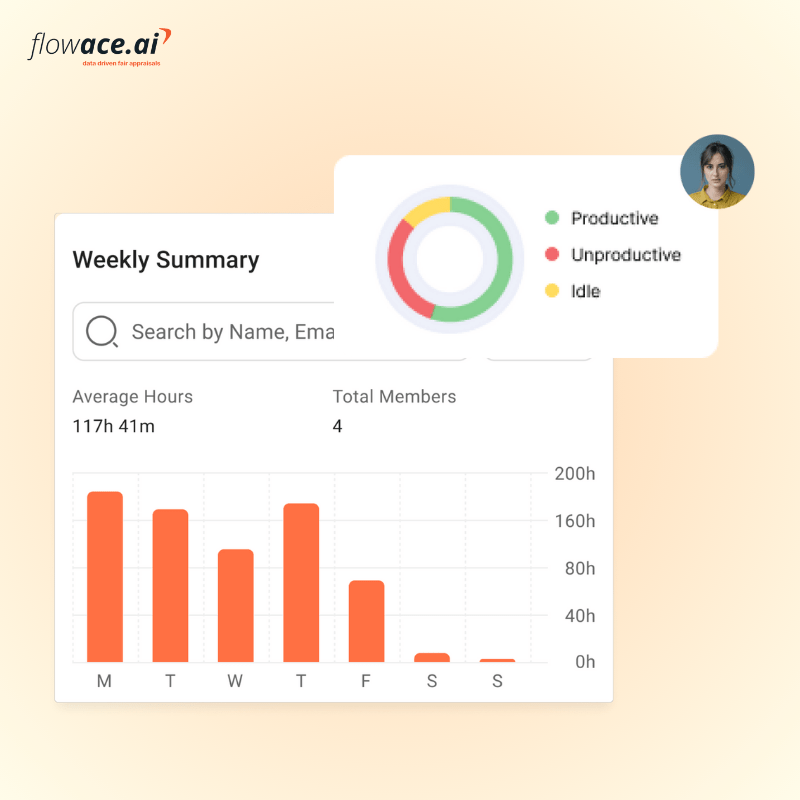
- Tools like Flowace simplify monitoring: Automated tracking, role-based classification, and dashboards make it easy to see productive vs unproductive time.
If it feels like your team is busy all day but still falling behind, distractions may be the culprit. As a founder or manager, you’ve likely seen it happen: quick standups turning into long conversations, constant Slack interruptions, or team members drifting through news and social feeds. Studies show employees waste one to two hours each day on non-work internet activity.
What makes this especially challenging is that most of this lost time is invisible. It doesn’t show up as obvious underperformance.
In this guide, we’ll help you identify which apps and website usage is draining your team’s productiity and how to reclaim it.
The Invisible Impact of Unproductive Apps and Websites Usage
“Killing productivity” may sound dramatic, but the idea is simple: it refers to activities that consume work time or mental focus without delivering meaningful value. What counts as a distraction, however, depends heavily on the role.

For a software engineer, it might be endlessly jumping between Stack Overflow tabs or YouTube instead of writing code. For a marketer, it could be doomscrolling social media while a campaign deadline approaches. The behavior changes, but the result is the same: lost focus and slower progress.
The data shows just how common this is:
- Surveys reveal that 53% of workers regularly post on social media during work hours, and 47% say tools like email and Slack often lead to wasted time.
- One study found that small business owners lose an average of 1 hour and 36 minutes per day on non-work tasks (more than three weeks a year).
- Nearly 17% also point to constant context-switching between tools as one of their biggest productivity drains.
In every role, the tools, apps or websites your team uses generally fall into three categories: productive (they help get the job done), neutral (breaks, light research), or distracting (non-work chatter or entertainment).
The key to protecting your team’s productivity is getting clear on what “core work” actually means for each role and then classifying the apps and websites required to do that work as productive. Once that foundation is in place, it becomes much easier to spot distractions and keep your team focused on what truly matters.
How App and Website Usage Tracking Reveals Productivity Killers
Before labeling any app or website a “villain,” it’s important to understand what a normal baseline actually looks like for your team. A baseline is simply your current, average level of performance before you make any changes.
For example, if your team logs 100 billable hours per week today, that number is your baseline. If your goal is to reduce wasted time or improve focus, you need reliable data on the current state before deciding what needs fixing.
As you review the data, watch for a few key signals:
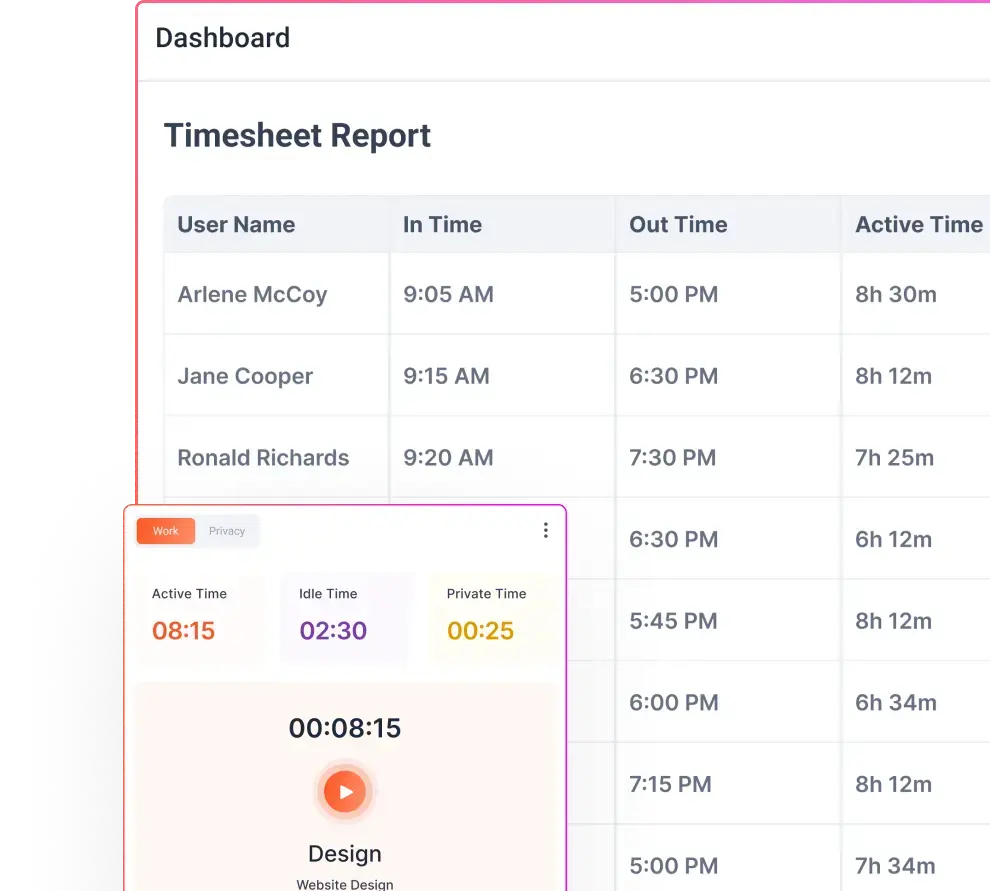
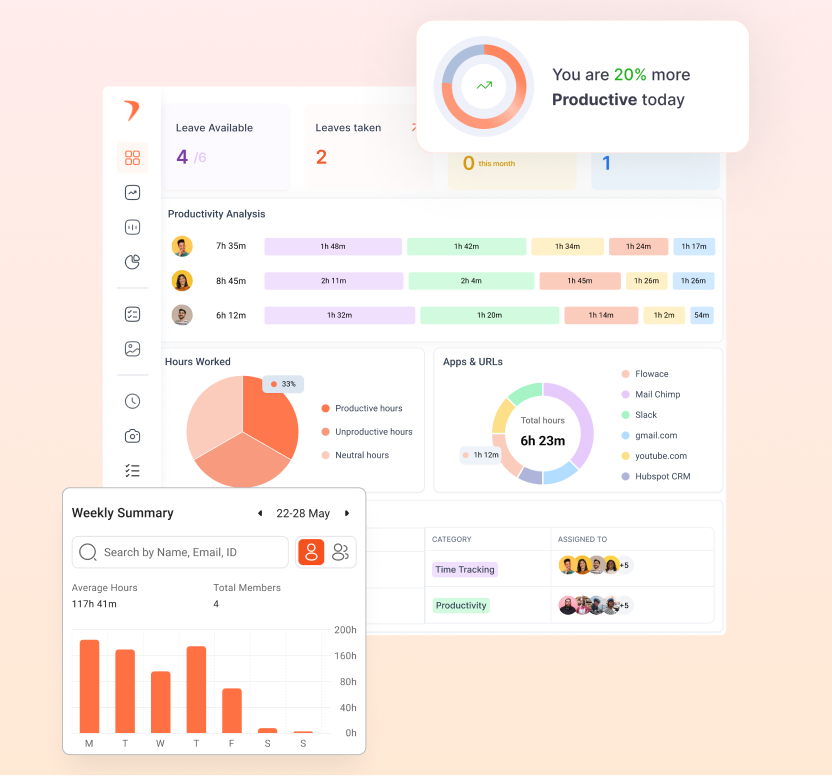
- Compare active time versus idle time.
- Look at total hours worked, and identify which apps dominate your team’s active hours.
A large share of time spent in non-business or entertainment apps is an obvious red flag.
Another important signal is frequent context switching. Lots of short sessions across many apps often point to constant interruptions, like nonstop Slack notifications breaking concentration.
Common Pitfalls To Avoid While Monitoring Employee Productivity
There are also a few common pitfalls to avoid while identifying your team’s baseline productivity:
- Don’t draw conclusions from too little data. You’ll want to collect at least a few weeks of information to account for natural fluctuations. Holidays, deadlines, or end-of-month crunches can easily skew the numbers.
- Avoid comparing dissimilar roles. What’s normal for a software engineer (long stretches of coding) will look very different from a customer support role that requires frequent app switching. Treating everyone the same will lead to mislabeling productive work as wasted time.
- Low productivity doesn’t always point to distracting apps. Sometimes, the real issue might be broken processes like unclear goals, inefficient workflows, or insufficient training. In these cases, removing apps won’t fix the problem.
Penalizing employees for “cyberloafing” only produces short-term gains. Monitoring works best when it’s used as feedback to help teams work better.
How to Analyze Productivity Data and Classify Apps/Websites as Productive vs Non-Productive?

Once you’ve collected the data, the next step is to analyze it. Start by asking a simple question: Which apps or websites are taking up the most time?
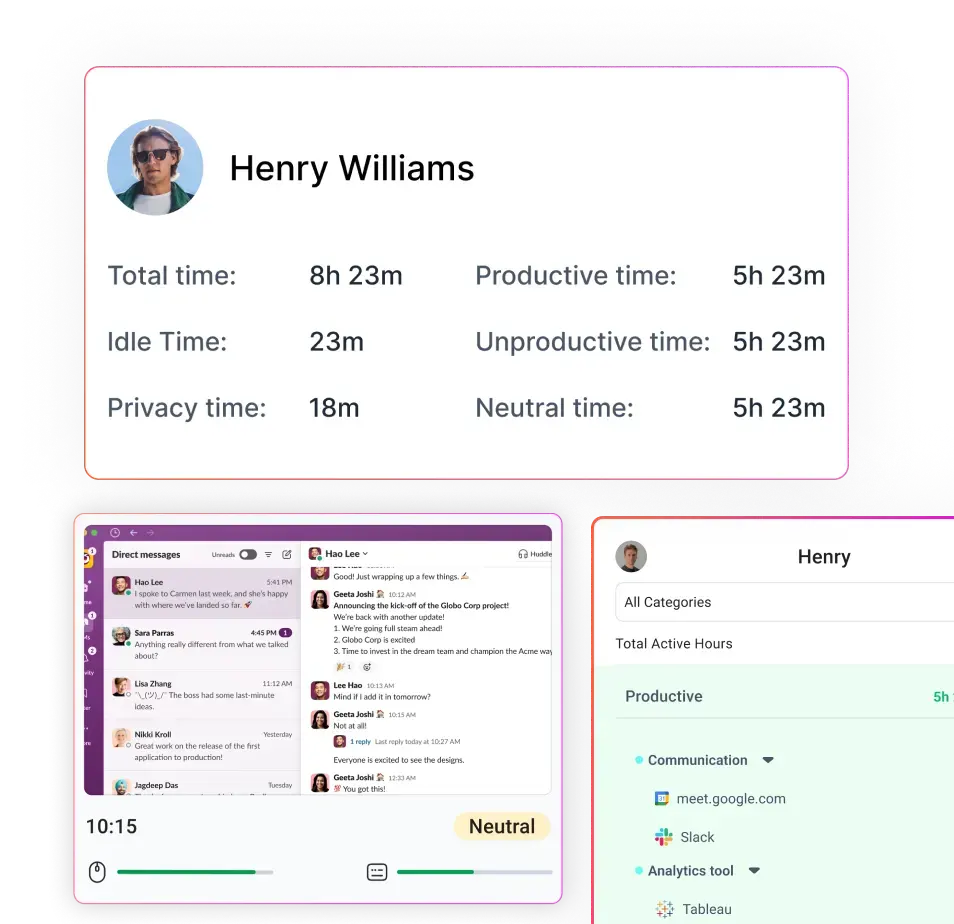
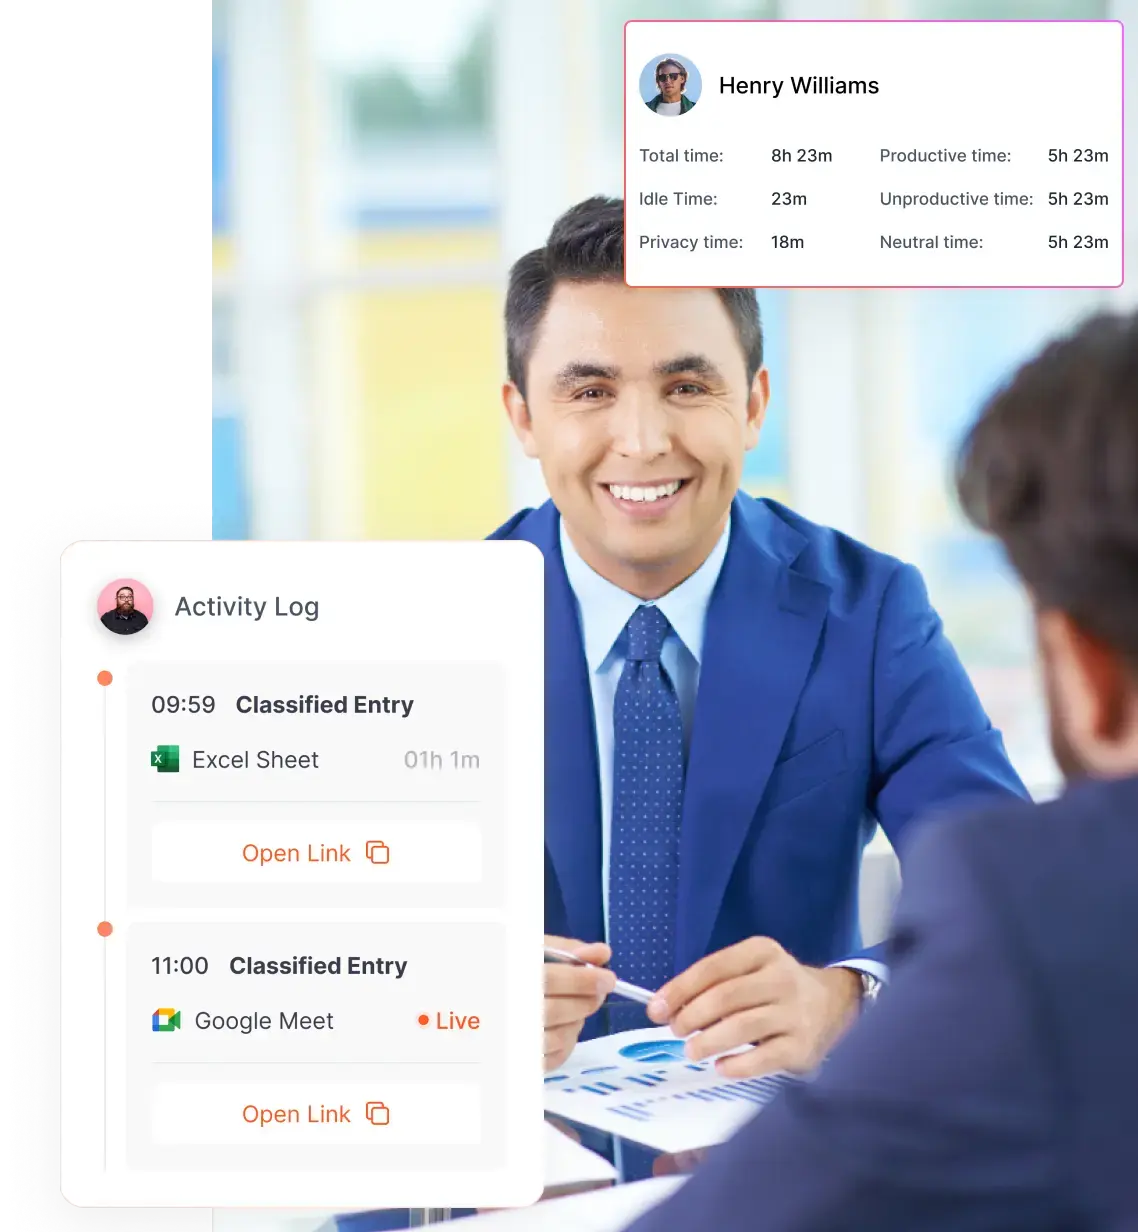
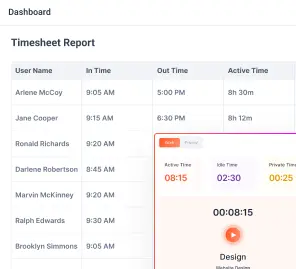
The simplest and most reliable way to find out is by using a time-tracking tool. For example, Flowace can automatically track how much time an employee spends in each app and website, starting from the moment the user logs into their system.
Once the tool is set up, you can dive into its reports to see:
- Top Apps by Time Spent
- Top Websites/Domains
- Activity Summary
- Usage Breakdown
These reports rank apps and sites by total time, making it easy to spot where the majority of work hours are going.
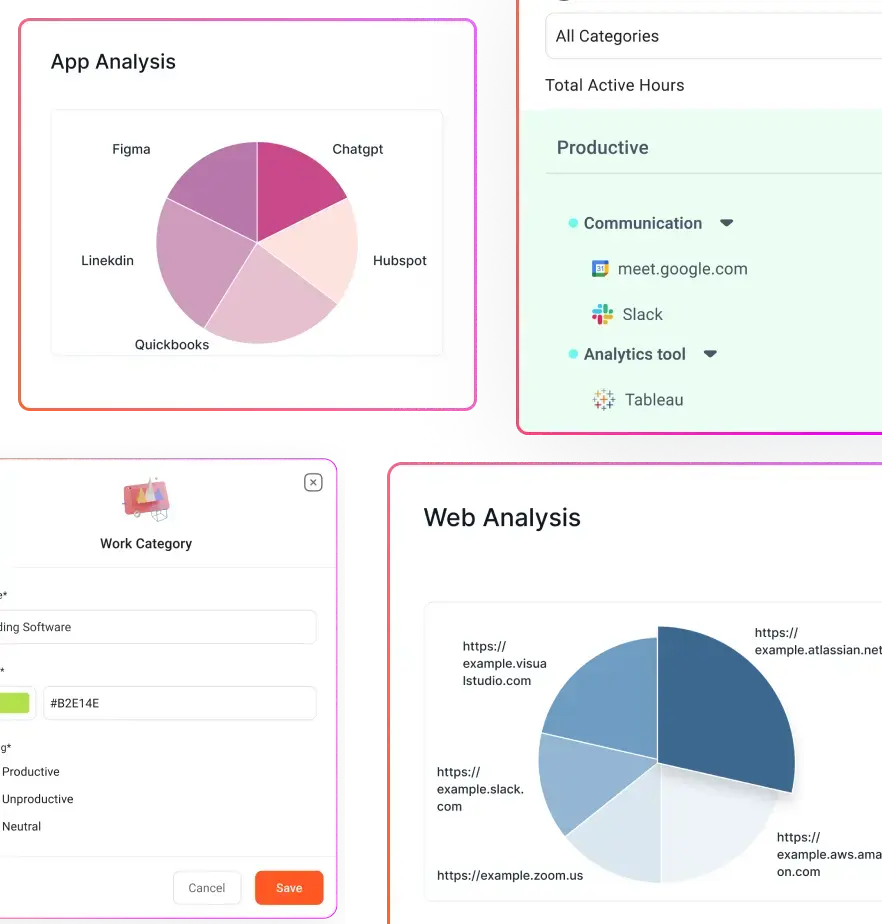
With this data, classify the apps and websites your team uses as productive, neutral, or unproductive. A simple way to think about it is:
- Productive: Tools that directly support work, such as CRMs, ticketing systems, IDEs, documentation platforms (like Confluence), code repositories (GitHub), finance software, and approved collaboration tools.
- Neutral: Sites used occasionally for breaks or learning, such as news websites, training platforms, or personal email (if allowed during breaks).
- Distracting/Unproductive: Apps and sites unrelated to work, including most social media, streaming platforms, shopping sites, and games.
What’s productive for one role may be a distraction for another. Hence, the key question to ask for each role is: Does this tool directly help someone complete their core work? If the answer is no, it’s probably a distraction.
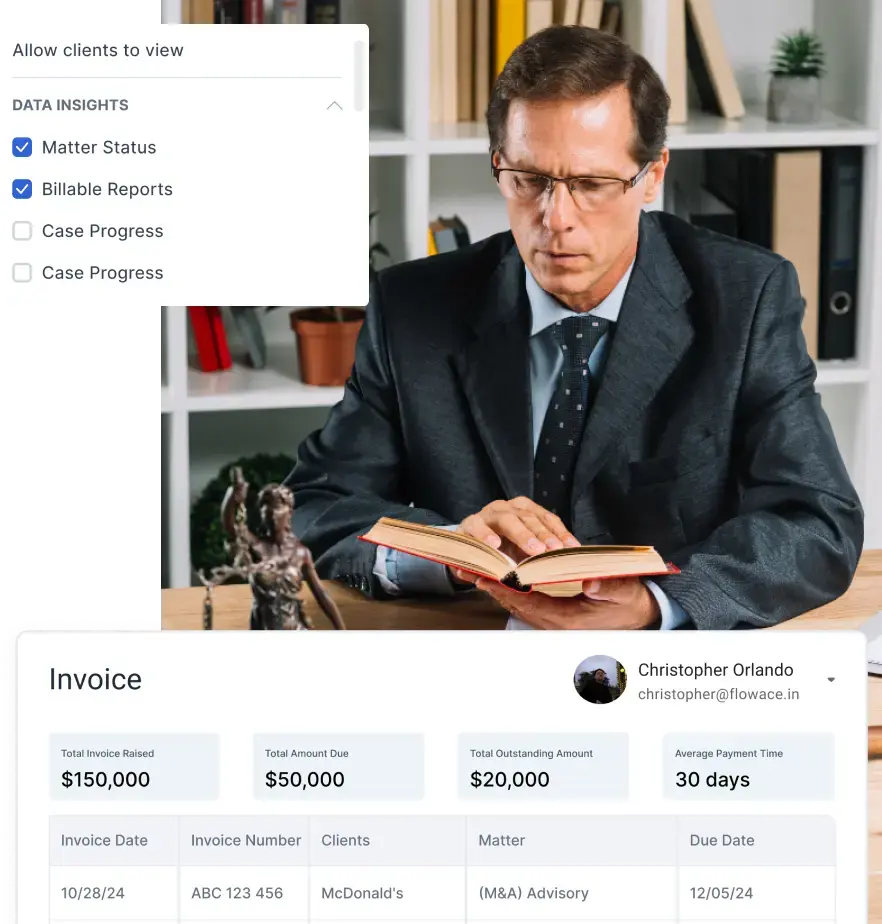
Flowace makes this easy by allowing you to tag apps and URLs as productive, neutral, or unproductive.
You can set different classifications for each department to reflect the work they actually do. For example:
- Engineering: IDEs, code repositories, and documentation are productive; social media or streaming sites are unproductive.
- Marketing: Social media and LinkedIn may be productive for research or outreach, while unrelated gaming or entertainment sites remain unproductive.
- Sales: CRMs, email, and LinkedIn are productive, while personal browsing or unrelated news sites can be tagged as neutral or unproductive.
By configuring these categories in Flowace, you ensure that the tool measures productivity accurately for each role.
How to Know When App/Website Usage Patterns Need Intervention
Patterns don’t tell you why something is happening. But they tell you where to look. Below is a practical checklist you can follow to decide when to act on app and website usage patterns:
- Unproductive time crosses a meaningful threshold: If more than 15% of paid time is spent on apps or sites considered unproductive for a given role, that’s worth reviewing. It doesn’t mean something is wrong, but it does mean you should understand why.
- Sudden spikes in usage: A sharp week-over-week increase in time spent on a specific app or domain is a red flag. Spikes often point to distraction, workflow breakdowns, or a tool being misused.
- One person stands out from their peers: When someone is spending three times the team average on a non-work site, it deserves a conversation.
- Constant tab or app switching: High context switching (lots of short sessions across many apps) often correlates with lost focus and lower-quality output.
- Idle time followed by frantic bursts: Long idle periods followed by intense activity can signal multitasking, burnout, or attempts to “catch up” at the last minute. Patterns like this are more telling than total hours alone.
- Outcomes drop while tool usage rises: If metrics like tickets closed, sales calls completed, or sprint velocity decline while time spent in tools increases, something isn’t lining up. That mismatch is a strong signal to intervene.
- Repeated overrides or policy exceptions: When the same person repeatedly ignores focus modes or overrides usage controls, it suggests either friction in the system or intentional avoidance. Either way, it shouldn’t be ignored.
- Compliance or security concerns: Accessing risky or blocked sites, or logging unusual access times, is non-negotiable. These cases should be escalated immediately, regardless of productivity impact.
Practical thresholds you can start with:
The goal of monitoring employees’ apps and website usage is not to punish them. It’s an early detection system that helps with better conversations, and healthier working styles. These metrics are a solid starting point, adaptable to your industry and team roles:
| Signal | Threshold | Recommended Action | Why It Matters |
| Team unproductive time | ≥ 15% of total time | Schedule a team-level review | May indicate workflow issues, unclear priorities, or misaligned tools |
| Individual unproductive time | ≥ 25% of total time | Manager check-in | Helps surface role mismatch, burnout, or personal blockers early |
| App usage spike | > 50% week over week | Root cause analysis | Sudden changes often signal distraction, process changes, or misuse |
| Tab switching frequency | > 30 switches per hour | Encourage focused work sessions | High context switching reduces concentration and output quality |
Next Steps
Identifying which apps and websites kill productivity is the first step to reclaiming your team’s time. It starts with establishing a clear, data-backed baseline so you understand how work actually happens.
Using automated tools like Flowace makes this process far more accurate and far less intrusive. Flowace automatically tracks app and website usage, helps you classify activities based on each role, and gives you a clear picture of where productive time is going versus where it’s being lost.
More importantly, Flowace is built to balance transparency, automation, and accountability. It encourages healthier work habits, such as focused work sessions and timely break reminders.
Curious how this would work for your team? Schedule a free Flowace demo or start a free trial and see how small insights can lead to meaningful improvements.
FAQs:
Q: What exactly counts as a “productivity killer” app?
A: It depends on the role, but generally any app or site that consumes significant work time without supporting core tasks qualifies. If its time share is high and it doesn’t contribute to outcomes, it’s likely a productivity killer.
Q: How can I track apps and websites without violating privacy?
A: Use tools like Flowace that track time spent—not content—and exclude personal data, with full employee transparency and consent. Focus on high-level usage patterns on work devices only.
Q: Won’t employees just find ways to cheat or hide usage?
A: Heavy, punitive monitoring often backfires, while transparent, trust-based tracking encourages self-correction. Modern tools also detect idle time, making sustained misuse hard to hide.
Q: Can Flowace show which specific apps or sites to target?
A: Yes, Flowace ranks apps and websites by time spent and lets you tag them by productivity, making problem areas immediately visible.
Q: Does this work for remote or hybrid teams?
A: Yes, productivity tracking is especially useful for remote teams, as long as home privacy is respected and expectations are clearly communicated.
Q: Can monitoring hurt morale?
A: It can if misused, but when framed as feedback and paired with support, many employees find the insights helpful rather than intrusive.