Workforce analytics might sound technical, but it’s actually pretty simple. It is the practice of collecting and analyzing employee data to boost performance, reduce turnover, and optimize your operations.
In this guide, you’ll learn what workforce analytics means, why it matters, and how you can use it to improve your workplace. We’ll walk through the biggest benefits, share some real-world examples, and give you tips on how to get started right away.
What is Workforce Analytics?
Workforce analytics helps you gather information about your employees and how they work. It combines data from HR systems (e.g. demographics, attendance, performance reviews) and operational tools (e.g. time tracking, project management apps) to reveal patterns and insights about your workforce.
In simple terms, it means looking at real numbers about how people work so you can improve how your business runs.

Often used interchangeably with people analytics or HR analytics, workforce analytics takes a broad view of employee data to optimize everything from hiring and training to day-to-day productivity.
According to the Society for Human Resource Management, 71% of HR leaders who use people analytics say it’s key to their strategy. It helps you improve everything from hiring and onboarding to boosting productivity and keeping employees engaged.
Why is Workforce Analytics Important?
Workforce analytics transforms raw HR and work data into actionable intelligence.
Companies that leverage workforce analysis can identify problems and opportunities in advance, make better decisions, and gain a competitive edge in talent management.
Here’s why workforce analytics matters:
- Your People Are Your Biggest Investment: Employees often make up 70% of total business costs in some industries. So, even small improvements in productivity or retention can lead to huge savings without hiring new people.
- It Helps You Make Better Decisions: Want to know which hiring channels bring in the best employees? Or which training actually boosts performance? Workforce analysis gives you answers based on real data.
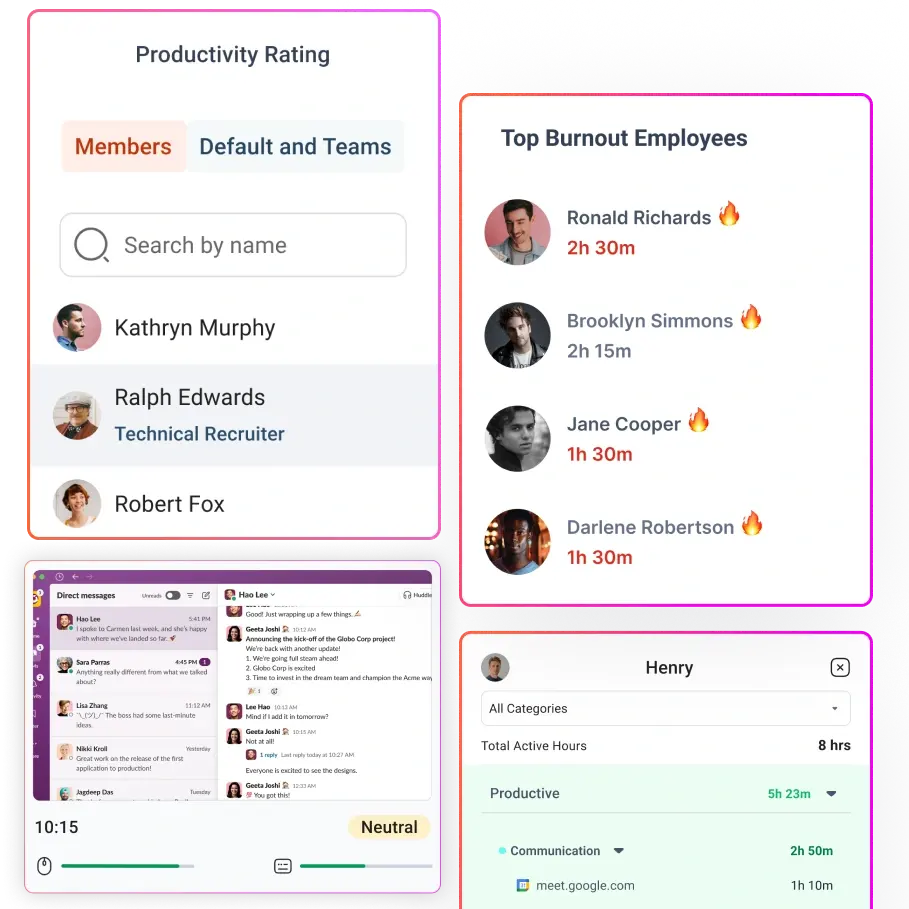
- You Catch Problems Early: Analytics lets you spot red flags before they blow up. Maybe one team has high turnover. Or maybe people are clocking too much overtime, signaling employee burnout. When you see these signs early, you can take action early to adjust workloads according to your team’s bandwidth.
- You Optimize, Not Just Fix: Workforce analytics shows you what’s working for your business. You can find out what top performers do differently and spread those habits across the team. You’ll also see which training or engagement strategies actually deliver results.
- It Ties People to Performance: At the end of the day, analytics helps you link employee metrics to business outcomes. You can make sure the right people are in the right roles at the right time. Say you discover support teams work best when they handle no more than 20 tickets a day, you can justify hiring more or shifting workloads to hit that number and boost customer satisfaction.
Let’s Understand the Benefits of Workforce Analytics
Implementing workforce analytics can yield a wide range of benefits. For Example:
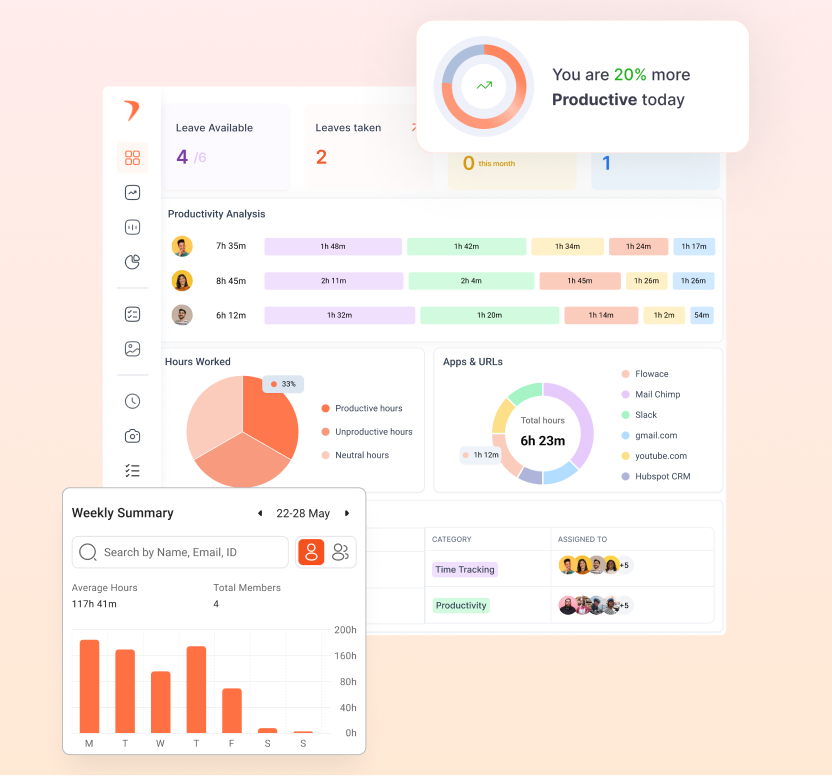
1. Boosts Productivity Without Burning People Out
Most employees operate at about 60% productivity. But using tools like Flowace has proved to improve employee productivity by 31%.
By tracking how work actually happens, you can cut unnecessary meetings, reassign idle talent to busy projects, and teach teams to work smarter. These small improvements add up significantly.
2. Helps Managers Coach Smarter
With workforce analytics, you get data for more effective coaching and decision-making. So, managers no longer have to rely solely on gut feeling or anecdotal evidence to understand their team’s performance.
For example, if one team member has low output, a manager can offer targeted support. If another is excelling, they can reward them or even ask them to share best practices.
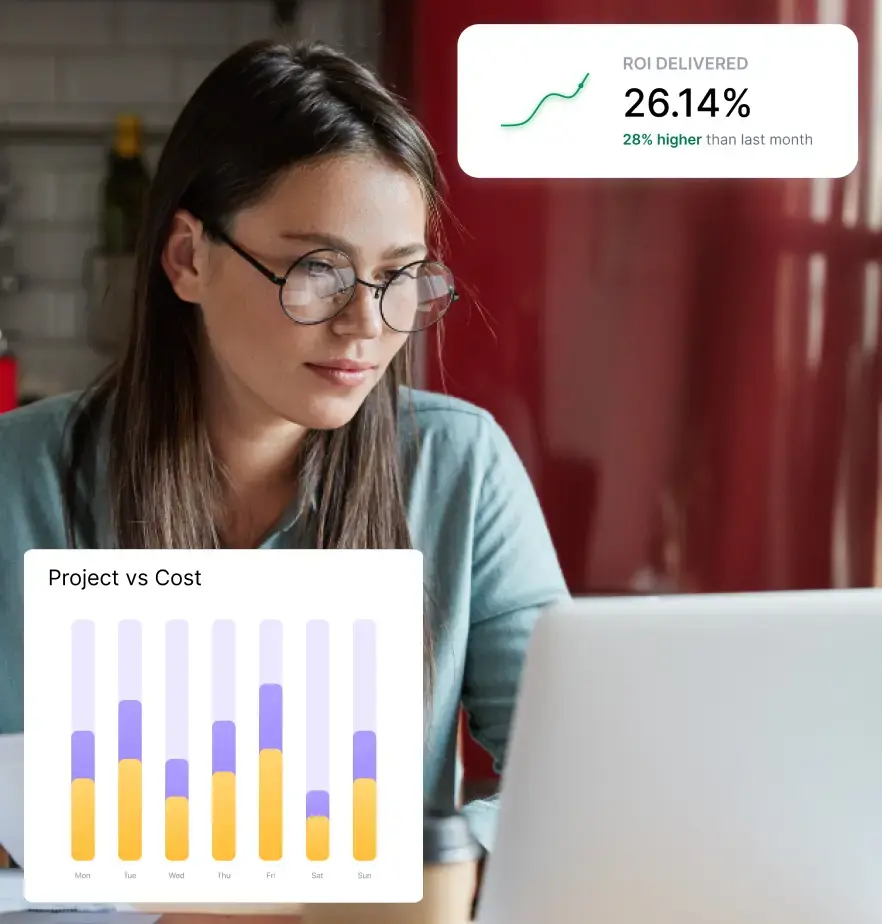
You can also track the ROI of your training. Say someone’s performance improves by 10% after a course, you know that your training material works.
3. Builds a Culture of Transparency and Trust
Workforce analytics gives you a fair way to make decisions based on real performance data. That means less bias when it comes to raises, promotions, or recognition.
It also helps you keep tabs on your employees’ well-being. For instance, if a team’s always working overtime, you can step in before burnout hits. Or you might notice that no one’s using their vacation time, which is another red flag.
Everyone sees how their work ties into company success. Over time, this creates a culture of openness, support, and shared goals.
4. Makes Leadership More Strategic
At the leadership level, workforce analytics provides the strategic insight needed for more effective planning and decision-making. Let’s say you’re planning to expand or launch a new product. You can check whether your team has the skills to pull it off, or if you need to hire or train.
During tough times like the sudden shift to remote work during COVID, companies with good analytics adapted faster and smarter. They knew what roles to prioritize, where productivity was dipping, and how to respond.
5. Better Use of IT and Other Resources
Workforce analytics doesn’t stop with people. It helps you get more out of your tools, software, and office space, too.
For example, you might find you’re paying for tools no one uses. Or that a pricey app is only used by one team. Now you can cut what’s not needed and focus on what actually drives results.
You can also analyze how office space is used. If Marketing’s only coming in on Tuesdays, you don’t need their desks full-time.
On the IT side, analytics can show where downtime or tech issues are hurting productivity. Or spot where your service desk is overloaded.
It also helps with compliance. Tracking hours and overtime reduces payroll errors and helps you avoid legal slip-ups.
Workforce Analytics: Examples in Action
The below examples shows you how Flowace helps companies with Analytics Data:
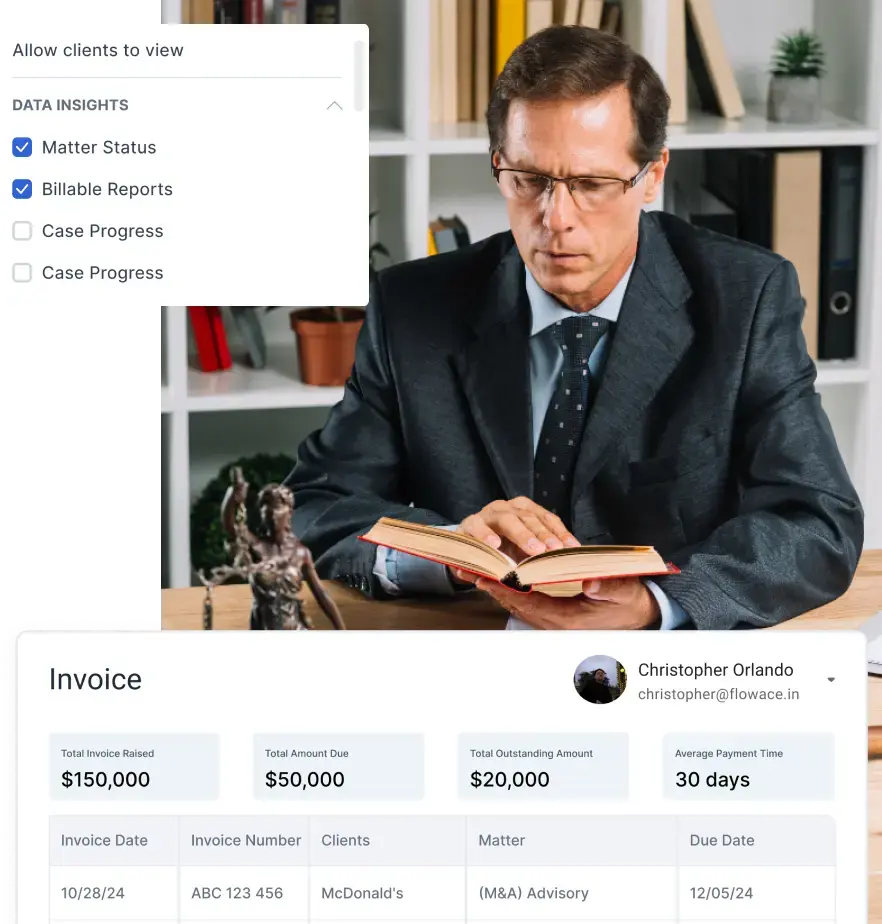
Gravitas Legal
- Problem: Lawyers spent valuable time manually filling timesheets and often underbilled clients because they couldn’t recall all tasks.
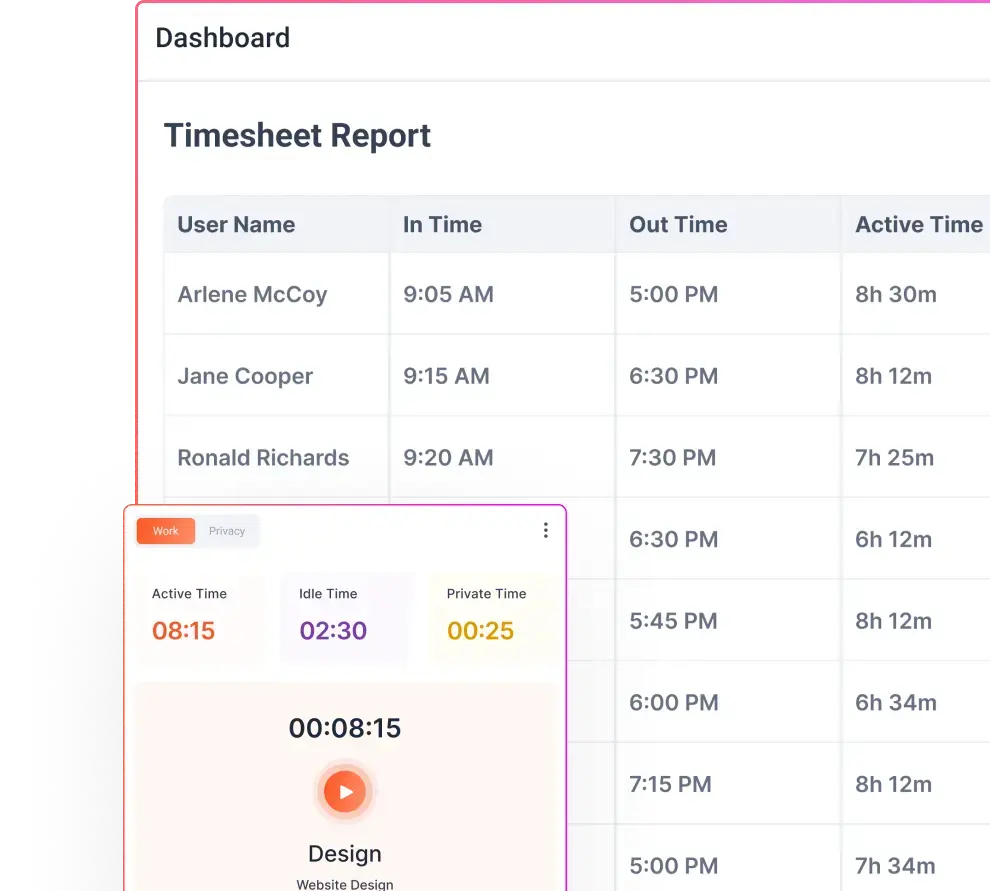
- Solution With Flowace: Flowace’s automatic timesheet‑filling and bubble classification captured every billable minute and organized tasks by matter. The work time analytics and Flowace’s billing and invoice features ensured accurate client invoicing.
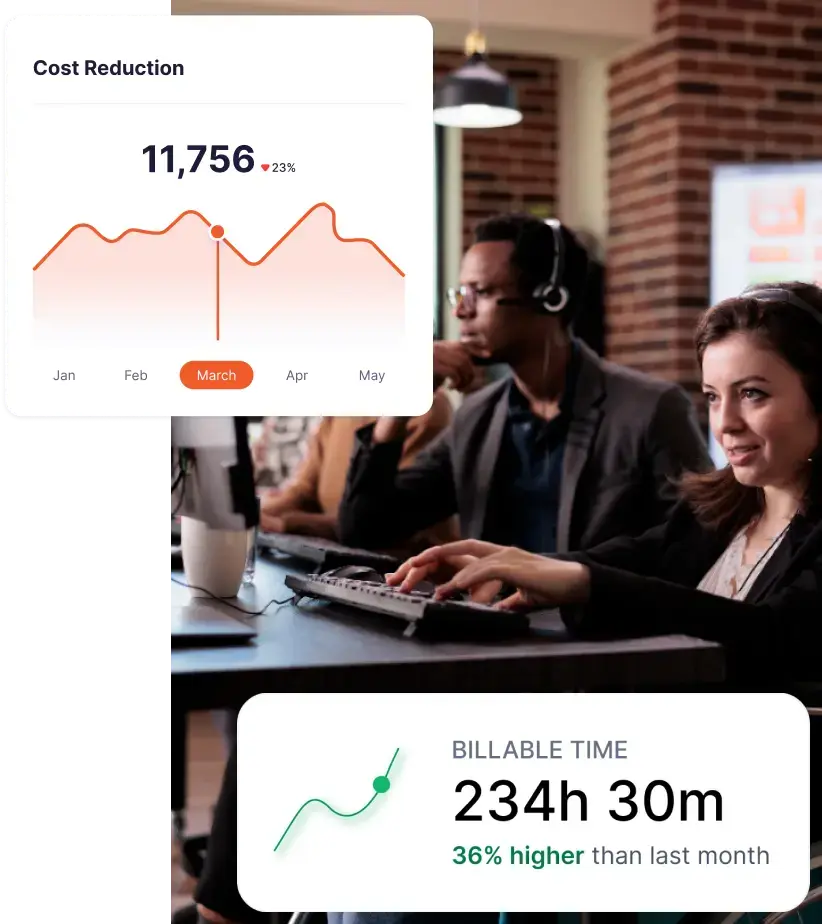
- Outcome: The firm saved an average of 36.74 minutes per lawyer per day, achieved 100% transparent billing, and eliminated underbilling. This shift also explains why so many firms are moving toward time tracking over block billing
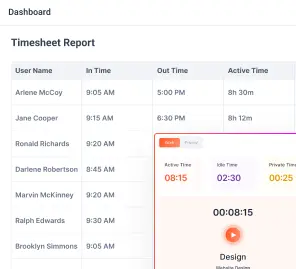
Digite
- Problem: This Silicon Valley startup relied on error‑prone spreadsheets for time tracking, leading to poor transparency and forgotten tasks.
- Solution With Flowace: Flowace’s automatic time tracker, work‑category analytics, custom work schedules, and leave management gave real‑time clarity without manual logging.
- Outcome: Digite saw a 20.91% lift in productivity, 100% work‑transparency, and drastically reduced admin overhead for attendance and task classification.
5 Types of Workforce Analytics You Need to Know
- Engagement Analytics: Measures how happy your employees are. Happier employees are more productive and stick around longer.
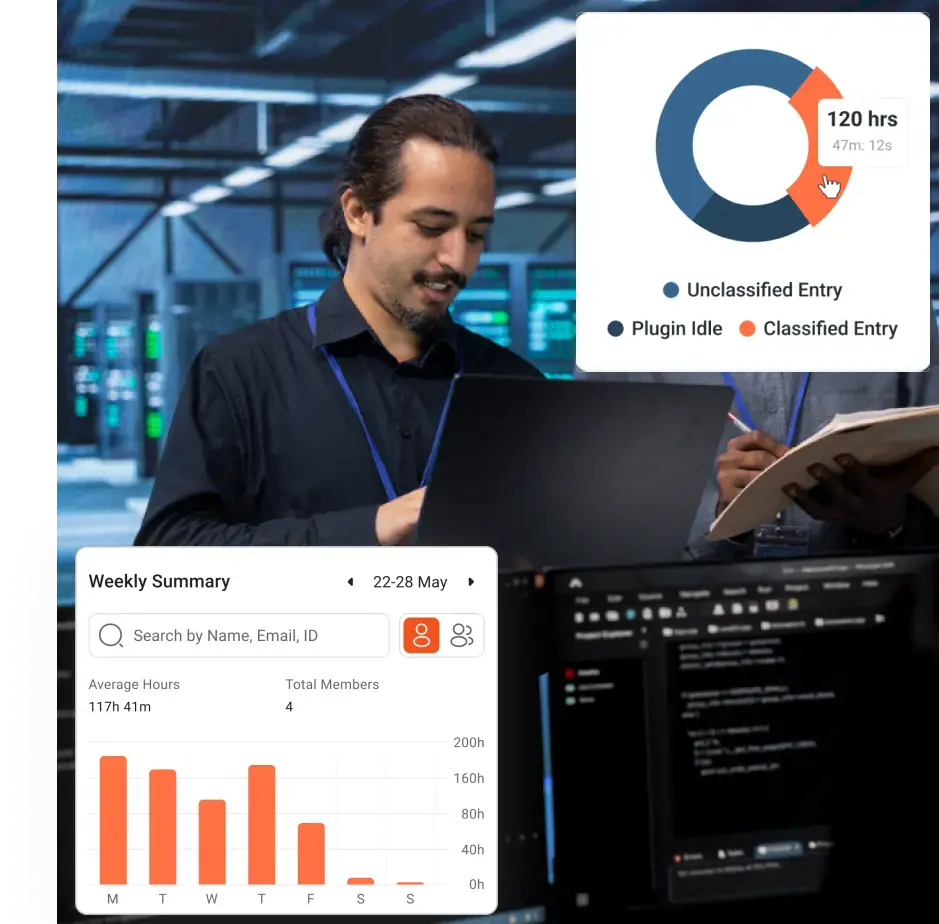
- Productivity Analytics: Tracks how efficiently people work. If productivity drops, you’ll know immediately and can address it.
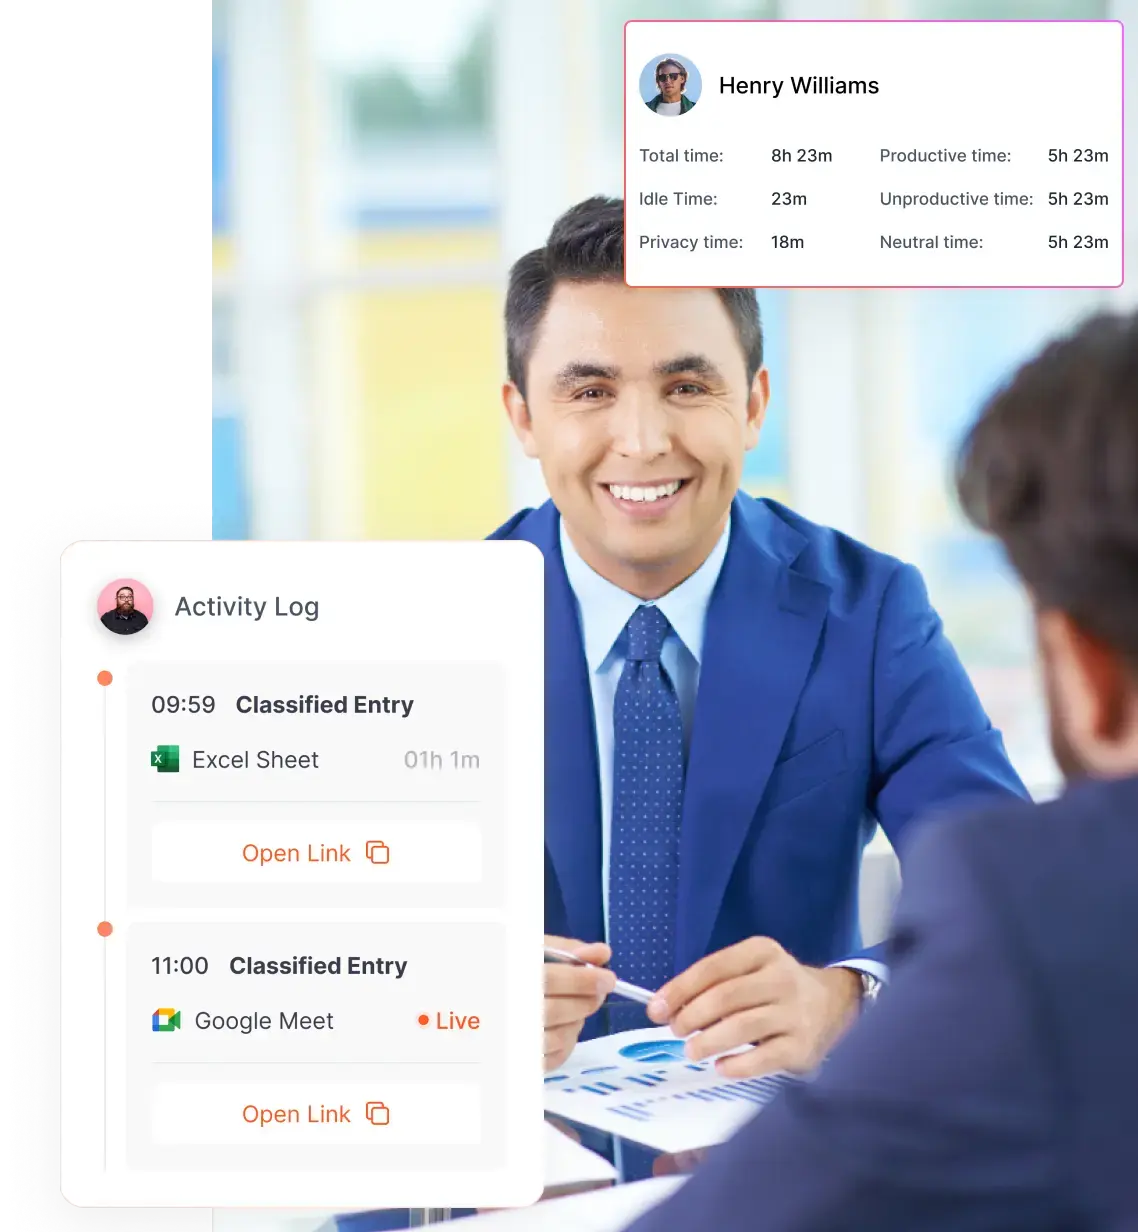
- Activity Monitoring: Checks what your team spends their time on, helping spot inefficiencies or risks.
- Operational Analytics: Shows you big-picture trends like where bottlenecks occur or how well you’re meeting compliance rules.
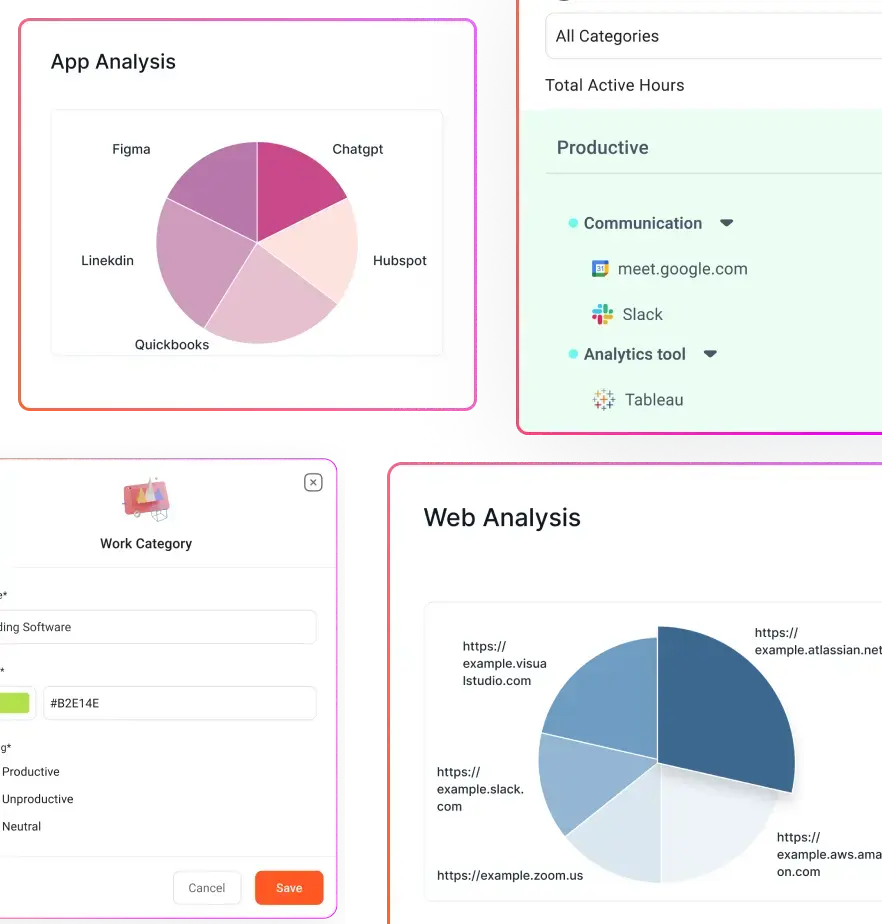
- Technology Management: Reveals if employees actually use your expensive software or tools effectively.
Common Challenges Workforce Analytics Helps You Solve
Here are some common challenges that analytics helps to solve or mitigate:
- High Turnover: Analytics can spot patterns, like spikes at two‑year tenure or exits under certain managers. By revealing pay gaps or burnout triggers, you can adjust compensation, map career paths, and balance workloads to keep top talent.
- Low Engagement: Surveys and sentiment scores linked to events (e.g., schedule changes) highlight dips in employee engagement. You’ll see when engagement drops and can roll out targeted fixes like leadership coaching or recognition programs.
- Wasted Time: Dashboards show where hours go. Maybe 30% of your team’s day is spent in meetings, or a three‑day approval process stalls projects. With that insight, you can shorten meetings or automate approvals to reclaim productivity.
- Staffing Imbalances: By tracking support tickets and comparing them against a Pitman schedule, you can pinpoint peak demand periods and staff accordingly. It signals the need for seasonal hires or overtime budgets.
- Skills Gaps: Compare current certifications to what’s needed. If no one holds a critical credential, you know exactly where to train or hire. Analytics on course outcomes also reveals which programs truly boost performance.
- Compliance Risks: Real‑time monitoring of hours, breaks, and mandatory training flags overtime or missing certifications, helping you stay within labor laws and avoid fines.
- Remote Work Visibility: Activity and project‑update trends let you see if remote staff hit productivity dips. Early warning of falling metrics means you can check in, offer support, and keep everyone on track.
Who Uses Workforce Analytics?
Workforce analytics isn’t just a tool for HR or executives. Everyone in the organization can benefit from the insights, albeit in different ways.
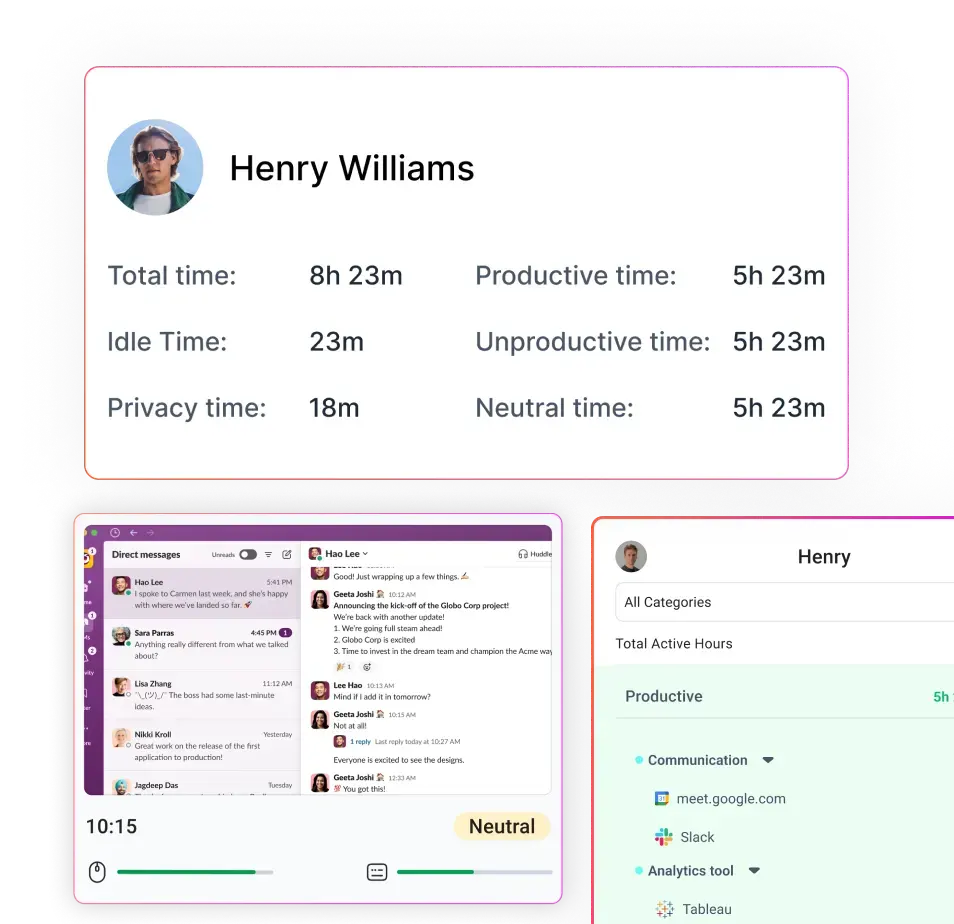
- For Employees: You get private dashboards showing your time use and performance versus goals, helping you spot distractions and boost focus.
- For Managers: It helps you identify each employee’s strengths and gaps, assigning stretch projects or training to keep development on track.
- For Executives & HR Leaders: It helps you set and monitor top‑level workforce KPIs, holding divisions accountable to productivity and engagement targets.
The History of Workforce Analytics and HR Analytics
You might not realize it, but using data to understand people goes back to the 1950s, when factories first tracked output and attendance. As computers arrived in the 1970s and ’80s, companies began storing personnel records digitally and measuring things like turnover and time‑to‑hire.
By the 2000s, “HR analytics” took off, thanks to pioneers like Google showing how data could predict who might quit or which hires would shine.
Today, “workforce analytics” goes further. It blends HR data with operational metrics like digital activity logs, sales figures, and customer feedback to give you a full view of how your team works.
Managers use real‑time dashboards, and employees even get personal insights to boost their own performance. The COVID‑19 era sped this up, as remote work made data on productivity and well‑being vital.
Now, modern tools and AI turn all that information into quick, actionable insights, so you can make smarter decisions about hiring, training, and running your business.
How to Implement a Workforce Analytics Program
You can kickstart a workforce analytics program in three simple steps:
- Be Transparent: Tell your team what you’ll measure and why. Explain how you’ll protect privacy and use insights to ease workloads. Open FAQs or town halls can help build trust.
- Communicate Clearly: Share the plan with everyone – HR, IT, managers, and frontline staff. Explain which data you’ll pull, who’ll analyze it, and how you’ll act on findings. Regular updates and quick wins (like “No‑Meeting Wednesdays”) keep your momentum up.
- Collaborate Across Teams: Form a cross‑functional task force with HR, IT, managers, and a few employees. Pool data from different systems and invite people to interpret results. This teamwork prevents blind spots and makes solutions stick.
Best Practices to Implement Workforce Analytics
You can make your workforce analytics stick by following a few simple best practices:
- Tie Analytics to Real Goals: Start with the big questions your business cares about, like cutting turnover or boosting productivity. When you focus on what matters, your data work won’t feel like busywork.
- Pick Clear KPIs: Choose a handful of metrics that map directly to those goals. Define them well, set targets (e.g., cut first‑year turnover from 25% to 15%), and make sure everyone agrees on what they mean.
- Use the Right Tools: Get a tech stack that fits your needs. You might need an HRIS for core data, a survey tool for engagement, and a BI dashboard like Power BI or Tableau for visual reports. Keep it simple and secure.
- Hunt for Actionable Insights: Look beyond trends to find “why” behind the numbers. Break down spikes or dips by department or tenure, then suggest fixes like extra coaching or process tweaks.
- Keep Improving: Treat analytics like a cycle: track KPIs, act on insights, monitor results, and tweak your approach. Share wins and adjust as your business evolves.
What to Look for in a Workforce Analytics Platform?
If you’re in the market for software or platforms to support workforce analytics, it’s important to know what features and capabilities matter most. Here are some things you need to look for:
Comprehensive Data Integration:
You need a platform that pulls HRIS, ATS, payroll, time‑tracking, engagement surveys, and more into one hub. Check for APIs and connectors so your Workday and Jira data merge seamlessly and stay accurate.
Real‑Time or Up‑to‑Date Reporting:
Decide if you need live dashboards that update instantly or daily/weekly refreshes. Aim for timely data. Last month’s turnover is fine, but six‑month‑old figures won’t help you act today.
User‑Friendly Dashboards and Visualization:
Look for clear, interactive charts and heatmaps with drill‑down capabilities. Non‑technical HR staff and managers should navigate templates (like turnover or diversity views) without calling a data scientist.
Analytics and AI Capabilities:
If you want predictive insights or flight‑risk alerts, choose a platform with built‑in ML models and benchmarking. Just be sure your team can actually use those advanced features.
Security and Privacy Controls:
Pick a solution with encryption, role‑based access, and compliance with GDPR or other relevant regulations. Managers should only see their own team’s data, and your cloud provider should hold ISO 27001 or SOC 2 certifications.
Collaboration and Sharing Features:
The best platforms let you export reports, schedule email digests, and annotate dashboards for team discussions. Role‑based portals help executives, HR analysts, and managers view only what matters to them.
Scalability and Performance:
Your analytics tool should handle more users and data sources as you grow, without slow dashboard loads. Ask about volume limits and performance benchmarks during demos.
Vendor Support and Expertise: Choose a vendor with a strong customer‑success team and consulting services to guide your rollout. Look at their roadmap to confirm they’ll keep adding features you’ll need.
Total Cost of Ownership:
Consider not just license fees but also implementation, training, and storage costs. If you already use Tableau or Power BI, see if they can cover your people analytics needs before buying a separate tool.
Why Flowace Stands Out?
Now that we’ve covered workforce analytics broadly, it’s worth examining how Flowace, a workforce productivity and analytics platform, differentiates itself in this space. Flowace is one of the modern solutions designed to help businesses track and boost team productivity, and it brings some unique value propositions to the table:
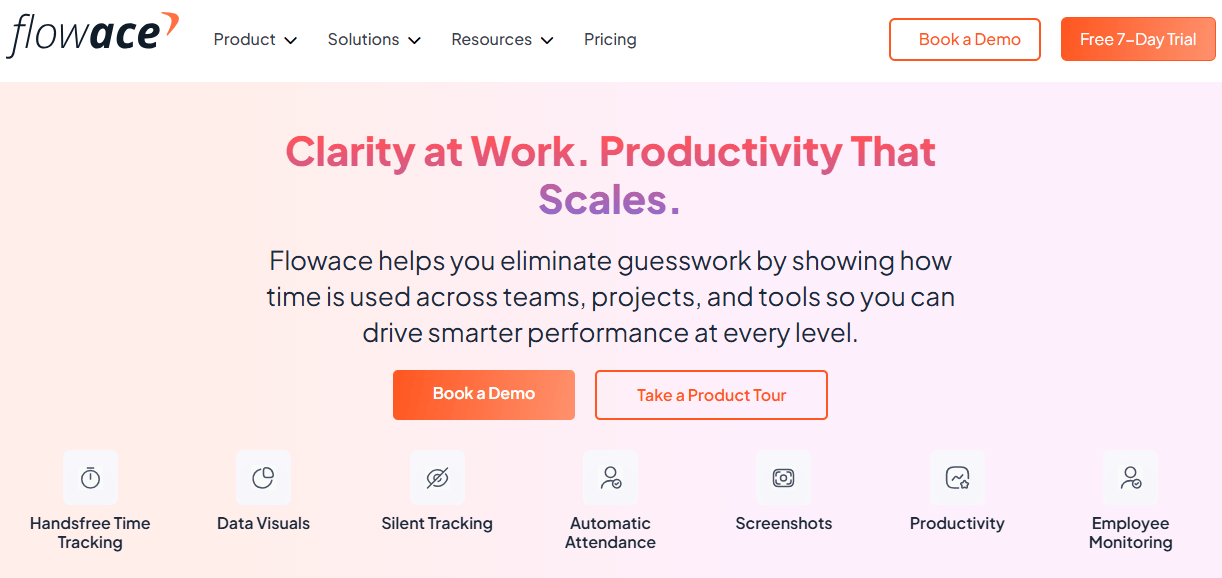
Flowace is unique because it:
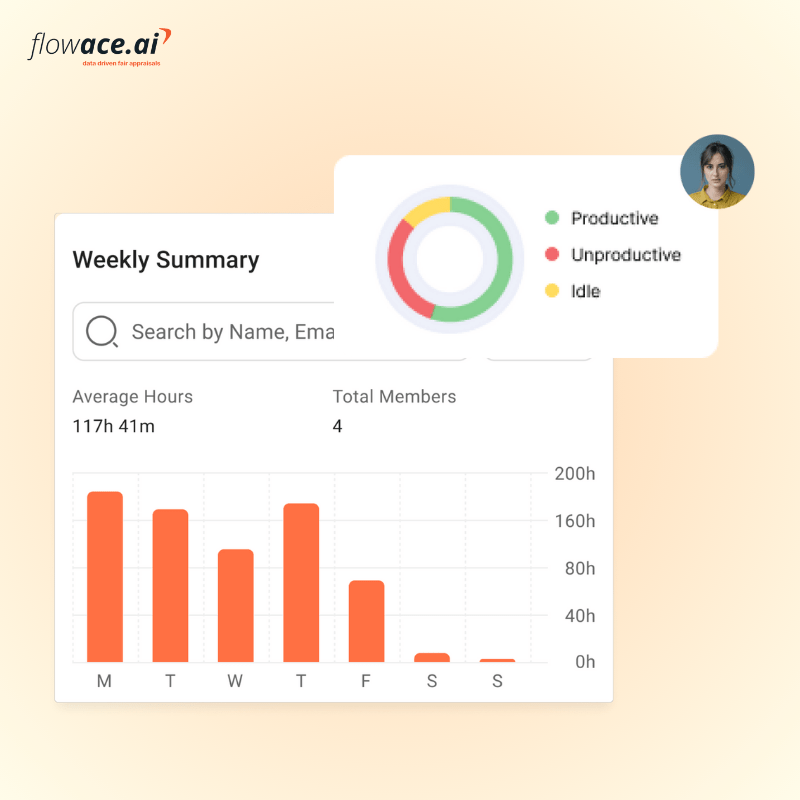
- Tracks productivity without being invasive.
- Uses AI to categorize activities automatically.
- Offers detailed task and project tracking.
- Integrates smoothly with tools like Slack, Zoom, and Asana.
- Focuses heavily on employee wellness and work-life balance.
All this at a fraction of the cost of many competitors (Flowace pricing starts around $2.99 per user per month).
Flowace’s USP (Unique Selling Proposition) lies in offering a rich set of workforce analytics and productivity features that are affordable, easy to use, and employee-friendly.
It bridges the gap between traditional time trackers and high-end people analytics platforms by giving actionable productivity insights in real time while fostering a positive work culture.
Getting Started with Workforce Analytics
By now, it’s clear that workforce analytics can offer significant advantages. Naturally, the next question is: How do I actually start implementing this in my organization?
Getting started with workforce analytics is about combining strategy, people, and technology thoughtfully. Flowace unifies all your HR, project, and engagement data into one easy dashboard. From automatic turnover alerts to custom KPI tracking, Flowace makes workforce analytics a breeze.
Intrigued? Try out Flowace for free with a personal demo today!
FAQs:
- What is workforce / people analytics, and why does it matter?
Workforce analytics uses data on employee behavior, skills, and performance to guide decisions about hiring, development, and retention. It matters because data‑driven insights boost productivity, engagement, and business outcomes. - What are the essential best practices in workforce analytics (data collection, privacy, dashboards, KPIs)?
Collect accurate, relevant data from multiple sources while respecting privacy and compliance rules. Then create clear dashboards and track a few aligned KPIs so stakeholders can act on insights quickly. - What typical tools and workflows are involved?
Organizations often integrate HRIS, ATS, time‑tracking, and engagement survey data into a BI platform or people analytics suite. Common workflows include data extraction, cleansing, analysis, visualization, and sharing with managers. - How can organizations measure outcomes like productivity, engagement, and burnout?
They track metrics such as output per hour, employee Net Promoter Scores, and average overtime or absence rates. By monitoring these trends over time, they can spot issues early and validate the impact of interventions.