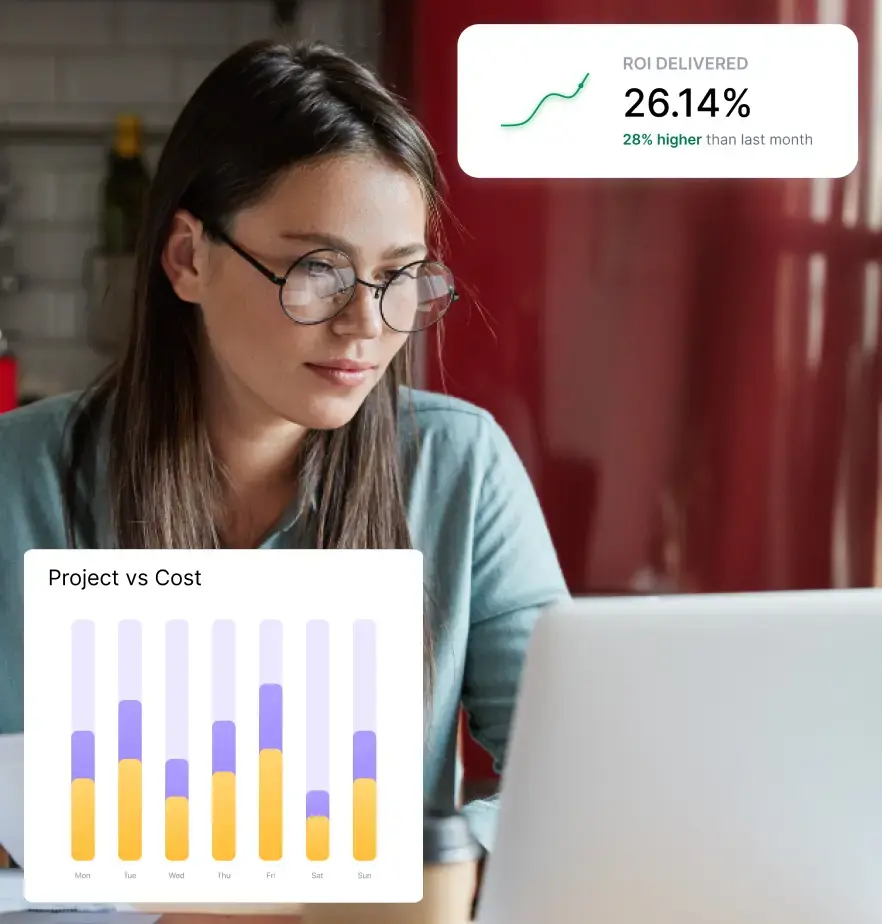
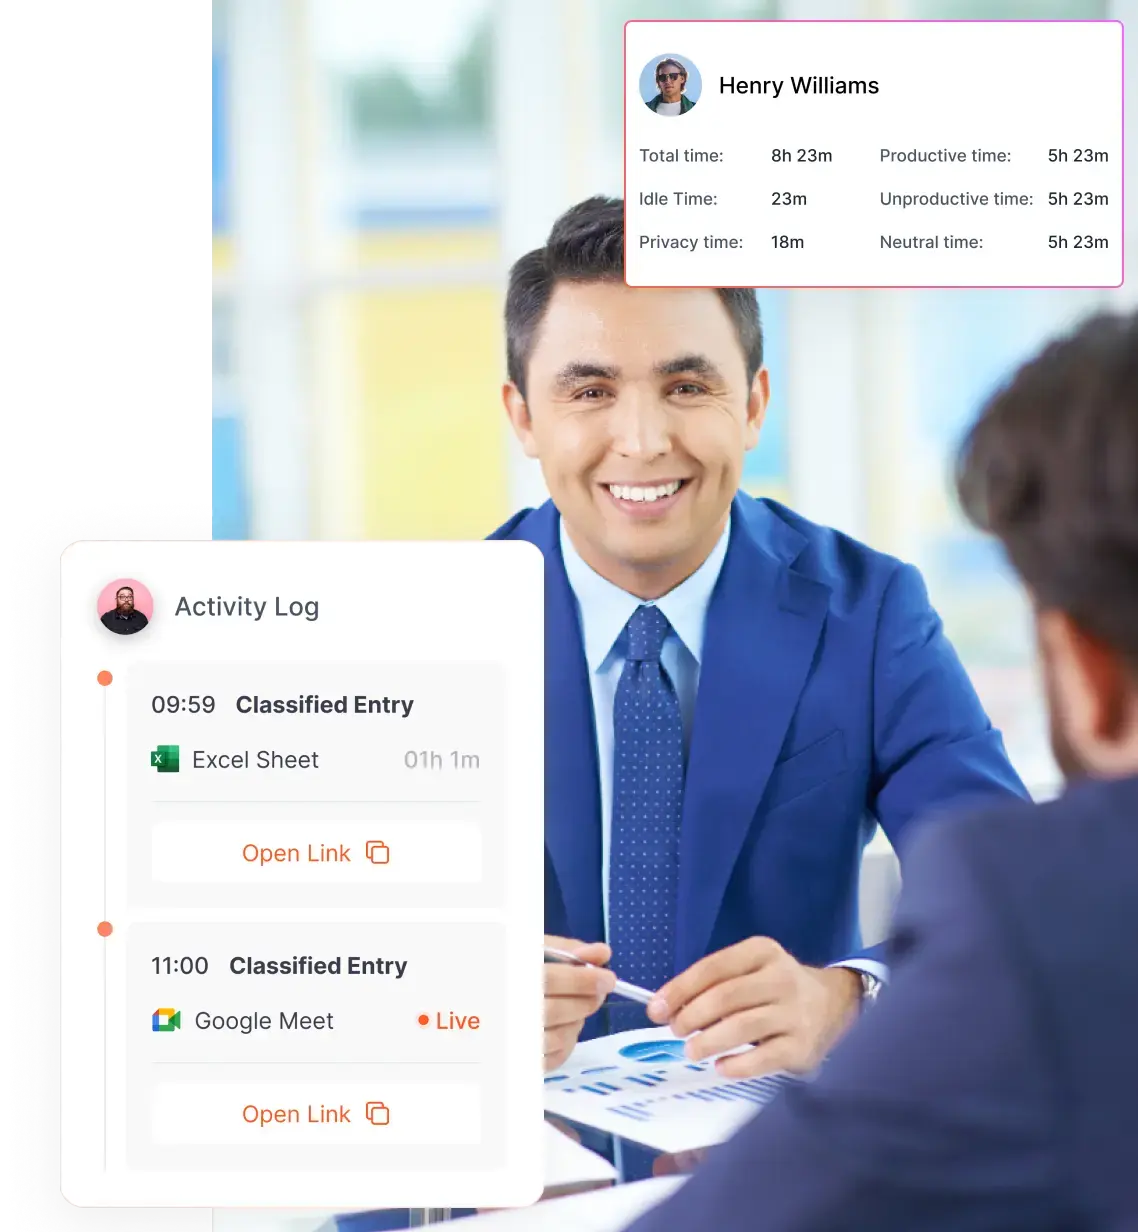
Employee performance dashboards are becoming a must-have tool for managers and HR professionals who want to streamline their operations, make smarter decisions, and create an environment where employees can truly shine. Think of it as a dashboard in a car, but instead of tracking your speed and fuel levels, it tracks your team’s output, engagement, and overall productivity.
The benefits it brings to the table can transform the way you approach performance management. These dashboards take the guesswork out of assessing employee performance, offering you a clear, real-time view of how things are progressing. Not only does this make it easier to spot opportunities for improvement, but it also allows you to celebrate achievements more effectively and foster a culture of continuous growth.
We’ll talk all about employee performance dashboards, so you have a solid understanding of what it entails.

What is an Employee Productivity Dashboard?
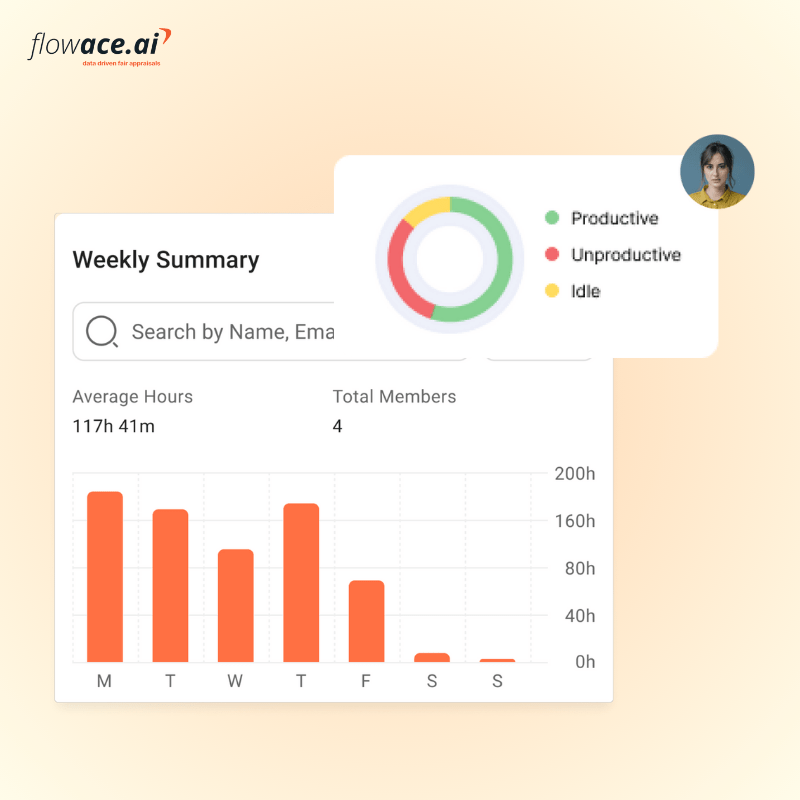
An Employee Productivity Dashboard is like your personal command center for tracking how well your team is doing. Instead of digging through spreadsheets and asking your team members for reports, you get a clear, visual representation of key productivity metrics, things like tasks completed, time spent on projects, efficiency levels, and even engagement insights.
It’s basically your secret weapon for smarter decision-making. If someone’s workload is too heavy, you’ll spot it early and redistribute tasks before burnout kicks in. If a project is lagging, you’ll know exactly where the bottleneck is. Plus, it’s not just for managers, employees can use it to track their own progress, set goals, and stay motivated.
Modern productivity dashboards integrate with the tools your team already uses, like project management software, CRMs, and collaboration platforms, so you get all the insights without the manual work.
Benefits of Using an Employee Productivity Dashboard
- Instantly see who’s on track, who’s overloaded, and where work is getting stuck
- No need to chase people for updates, everything you need is right in front of you
- No more digging through spreadsheets or manually tracking progress
- Get real-time insights at a glance, faster decisions, and less admin work
- Identify slow-moving tasks or projects before they become a problem
- See exactly where work is stalling and take action immediately
- Avoid overloading top performers while others have idle time
- Clear goals keep them engaged, accountable, and in control of their workload
- Monitor progress and tweak strategies without the guesswork
- Encourages a culture of continuous improvement, because what gets tracked gets improved
- Everyone knows what’s expected of them and how their work contributes to the bigger picture
- Keeps remote teams aligned and in sync, no matter where they’re working from
- Fewer unnecessary meetings because the dashboard tells you what’s happening
Key Metrics to Include
1. Individual Productivity
When we talk about individual productivity, it’s easy to assume it just means how many tasks someone completes. A well-designed productivity dashboard should give insights into how well an employee is meeting their goals, the complexity of the work they’re handling, and whether they are being set up for success.
If someone is completing a high number of tasks but requires constant revisions, the issue isn’t just their output, it could be a lack of clarity in expectations or the need for better training. Tracking productivity trends can also help identify when employees perform their best. Some people work best in the early morning, while others are more focused in the afternoon.
Instead of forcing a one-size-fits-all work schedule, these insights allow organizations to align workloads in a way that maximizes efficiency. Additionally, individual productivity tracking can highlight hidden workload issues.
If one employee is consistently overloaded while others have lighter assignments, that imbalance can lead to burnout. On the other hand, if someone is consistently underperforming, it’s not always due to a lack of effort, maybe they need better tools, more support, or a clearer understanding of expectations. By identifying these factors early, managers can offer coaching, redistribute workloads, and help employees grow instead of letting small inefficiencies turn into major performance issues.
2. Team Metrics
Even if each person on a team is working hard, overall productivity can still suffer if collaboration and workflow processes aren’t optimized. A productivity dashboard helps uncover the bigger picture, how well the team as a whole is functioning, where bottlenecks are happening, and whether work is moving forward smoothly. One of the biggest issues in team productivity is task dependencies.
If one person’s work is constantly holding up the progress of others, that’s a sign of an inefficient workflow rather than an individual problem. Maybe approvals are taking too long, or there’s a communication gap between different departments. A good productivity dashboard helps managers identify these patterns so they can streamline processes and prevent unnecessary delays.
Productivity is how high-performing teams communicate effectively, share knowledge, and support each other. If a team isn’t engaging with one another or if meetings are unproductive, these issues can drag down overall efficiency.
Additionally, a dashboard can reveal if a particular team is struggling compared to others, which may indicate a leadership issue, unrealistic goals, or a need for better tools and resources. Understanding these dynamics allows organizations to optimize teamwork without micromanaging, ensuring that processes, rather than people, are adjusted for maximum efficiency.
3. Time Tracking
Many organizations assume that longer hours mean higher productivity, but in reality, it’s the quality of time spent that matters most. A good productivity dashboard should show whether employees have enough uninterrupted time for deep, focused work or if their schedules are filled with distractions. One of the biggest culprits of low productivity is excessive meetings. If employees spend more time in meetings than actually working on their tasks, progress will slow down dramatically.
Tracking meeting time versus individual work time can help organizations cut unnecessary meetings and create a better balance between collaboration and execution. Another key insight from time tracking is identifying burnout risks. If employees are consistently working overtime or spending too much time on administrative tasks instead of their core responsibilities, that’s a sign that workloads need to be adjusted. On the other hand, if there’s a lot of idle time or employees frequently struggle to find tasks, that could indicate a lack of direction or underutilization of talent.
4. Employee Engagement
One of the best ways to measure engagement is through participation in company initiatives, training sessions, and team discussions. If employees are disengaged, they’ll often withdraw from these activities, which is a clear red flag that needs to be addressed. Regular employee feedback surveys are another crucial tool.
If employees are expressing frustration about their workload, leadership, or work-life balance, those insights should be taken seriously. Often, disengagement is a precursor to burnout and turnover, so spotting these trends early allows organizations to take action before productivity declines. Recognition and rewards also play a huge role in engagement.
If employees feel like their hard work isn’t being acknowledged, motivation will drop. A great productivity dashboard highlights and celebrates achievements, reinforcing a culture where people feel valued and encouraged to do their best.
5. Efficiency Metrics
Efficiency is about working smarter, not harder. Even if employees are putting in maximum effort, inefficient processes can slow them down, leading to frustration and wasted time. An effective productivity dashboard should highlight areas where work is getting stuck, whether it’s due to unnecessary steps, unclear instructions, or repeated errors that require constant rework.
One of the biggest barriers to efficiency is slow turnaround times. If projects consistently take longer than expected, the dashboard should help pinpoint where the delays are happening. Sometimes, the issue isn’t with employees but with process bottlenecks, such as approval delays, inefficient communication, or outdated systems. Another key efficiency metric is rework and errors.
If employees frequently have to redo tasks due to mistakes or unclear instructions, that’s a sign of either poor communication or a lack of proper training. A good dashboard helps identify whether these issues are isolated incidents or ongoing patterns, allowing organizations to adjust workflows and provide better support.

Tools for Building Productivity Dashboards
1. Project Management Tools
When it comes to building a productivity dashboard, project management tools really steal the show. These tools are the backbone of organizing, tracking, and overseeing tasks and projects within teams.
Not only do they help streamline workflows, but they also give a real-time pulse on project statuses and individual contributions. Think about platforms like Trello, Asana, or Monday.com. They break down projects into manageable tasks, assign deadlines, and provide visibility on who’s working on what. This level of transparency ensures everyone stays aligned with company goals.
When integrated into a productivity dashboard, project management tools give you instant insight into where a project stands, whether it’s on schedule, delayed, or at risk of slipping. They allow you to set milestones and deliverables, so you can keep track of progress. For example, if your team is working on a marketing campaign, you can monitor how tasks like designing visuals or drafting content are moving along.
You’ll know who’s ahead of schedule and who may need some support to meet a deadline. These tools can also reveal team member workloads, helping you distribute tasks more effectively, avoiding burnout, and ensuring no one is overwhelmed.
Using project management tools on a productivity dashboard means you’ll never be caught off guard. You can easily spot bottlenecks, identify underutilized resources, and shift priorities quickly. It’s like having a clear bird’s-eye view of everything happening within your team or organization, so you can make quick, informed decisions.
2. Time Tracking Software
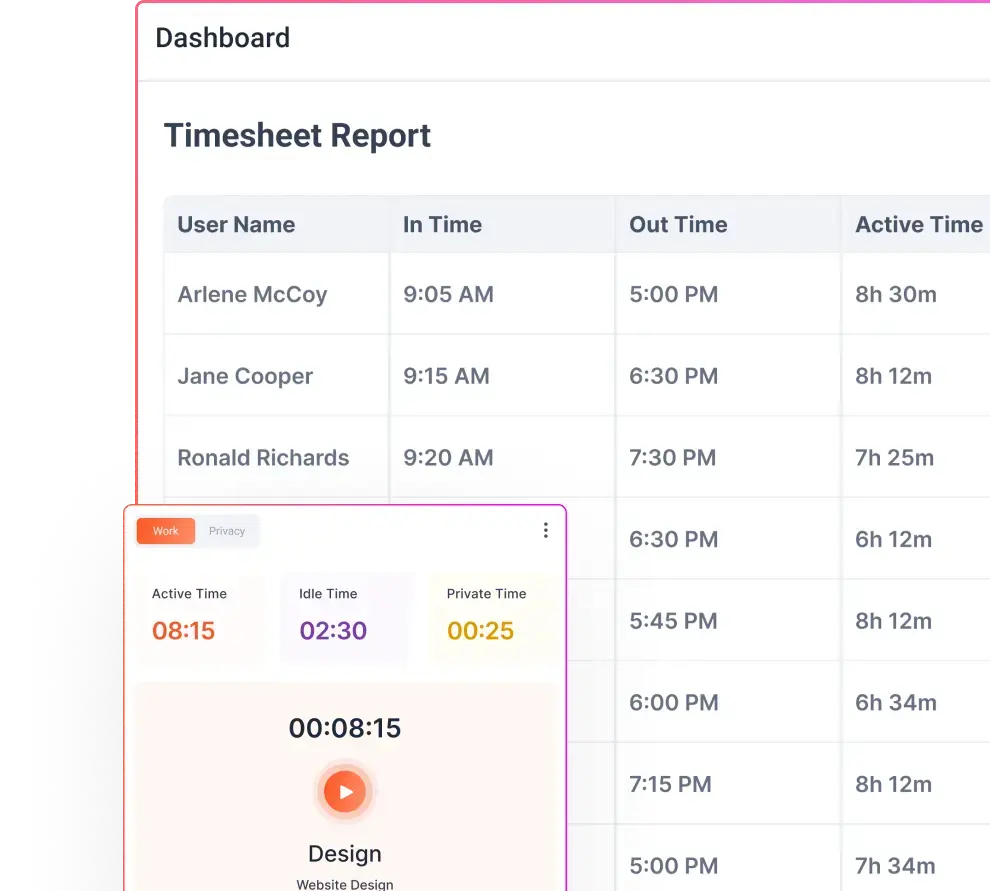
Time tracking software plays a pivotal role in ensuring that every minute spent at work is accounted for. While it’s easy to assume that a busy employee is a productive one, time-tracking tools reveal the truth behind the hours worked. These tools let employees log their hours, often in real-time, and categorize them by task or project. It’s about knowing how many hours someone worked; it’s about understanding where that time went. Tools like Toggl, Clockify, and Hubstaff capture detailed data about how employees spend their workday, from meetings to emails to deep-focus tasks.
When integrated into your productivity dashboard, time-tracking software provides powerful insights into employee productivity. You can see exactly how much time is being spent on different activities and identify areas of improvement.
These insights let you address issues early, ensuring that deadlines are met, and productivity remains high.
But there’s another side to time tracking that’s especially useful for managers: it promotes accountability. Employees know their time is being tracked, which often leads to better focus and task management.
3. Data Visualization Tools
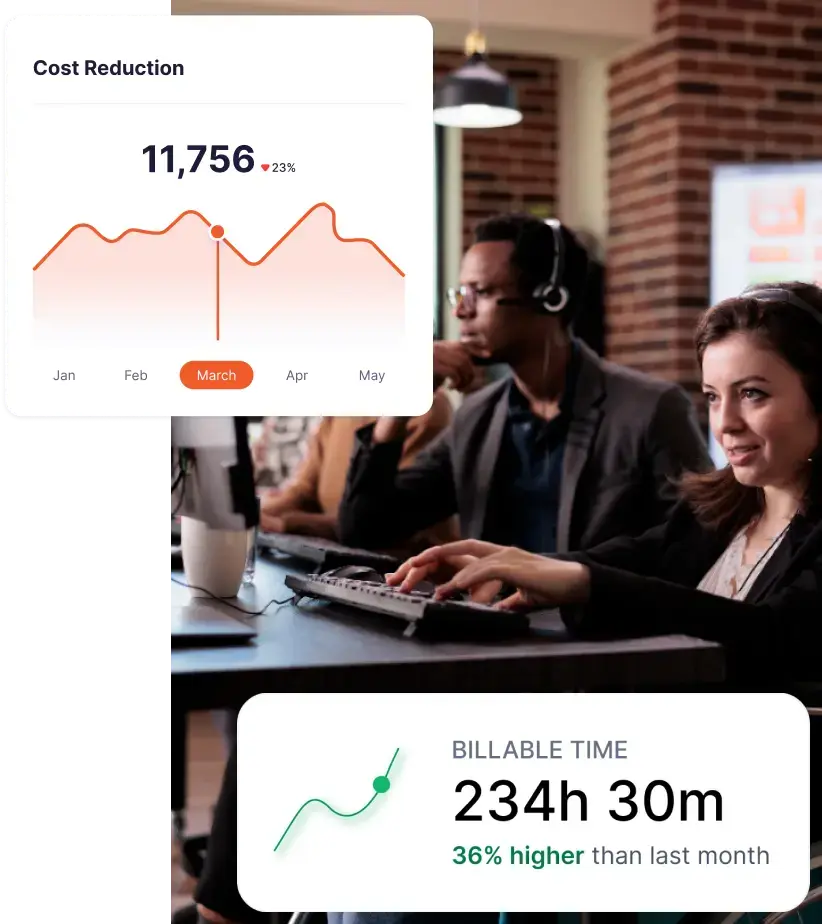
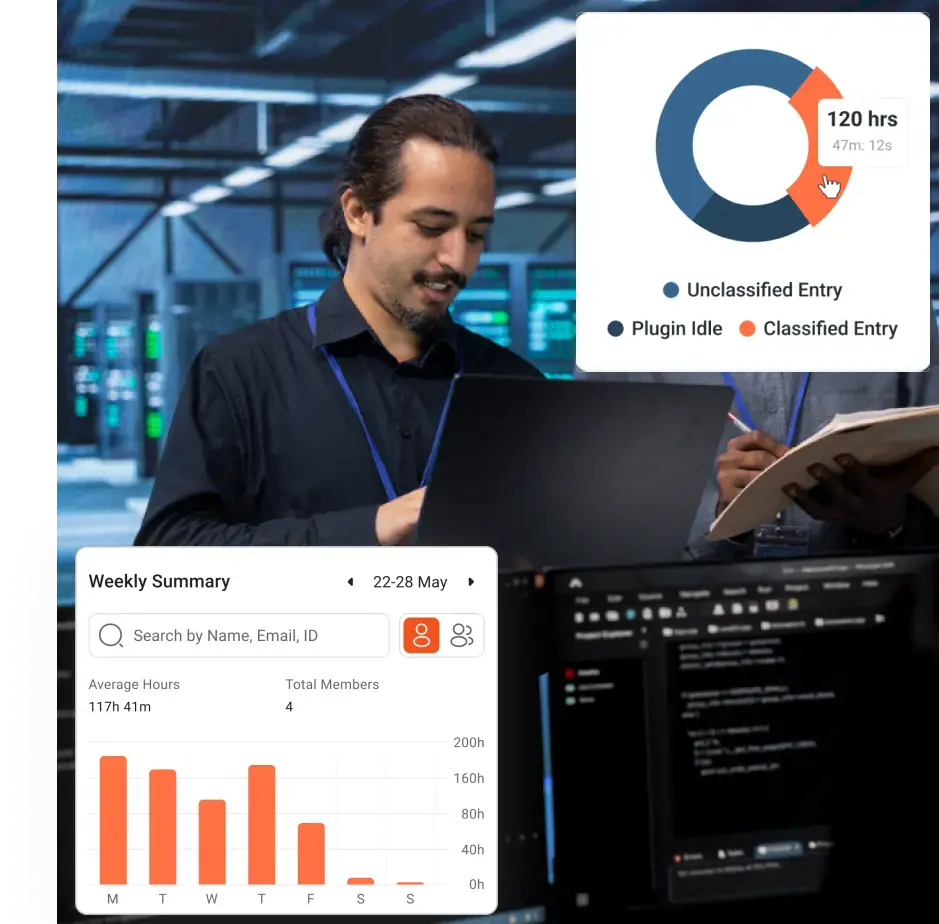
Data visualization tools take raw productivity data and transform it into something far more digestible. Instead of staring at rows of numbers or detailed spreadsheets, these tools turn everything into engaging, colorful graphs, charts, and interactive dashboards.
Imagine trying to analyze how many tasks were completed this week, who’s on target with their goals, or what team is lagging behind in productivity, all with just a glance at your screen. This is where tools like Tableau, Power BI, or Google Data Studio shine. They connect to your other productivity tools and pull all that raw data into a visual format that’s easy to interpret.
Data visualization makes it much easier to spot trends, outliers, and patterns. For example, if you’re tracking team performance across various projects, a data visualization tool can quickly show you which teams are consistently hitting their targets and which ones might be struggling. This could be represented in a heatmap, bar chart, or line graph. You can also use it to compare individual productivity levels, making it clear who’s excelling and who may need additional training or support.
4. Employee Monitoring Tools
Employee monitoring tools are often seen as a bit of a double-edged sword—they can be incredibly useful, but they also come with concerns about privacy and trust. However, when used appropriately, they provide invaluable insights into how employees are spending their time, especially in remote or hybrid work environments.
These tools can track everything from app usage to keystrokes to time spent on various websites. While it might sound intrusive, they offer transparency into workflows and can reveal where improvements can be made.
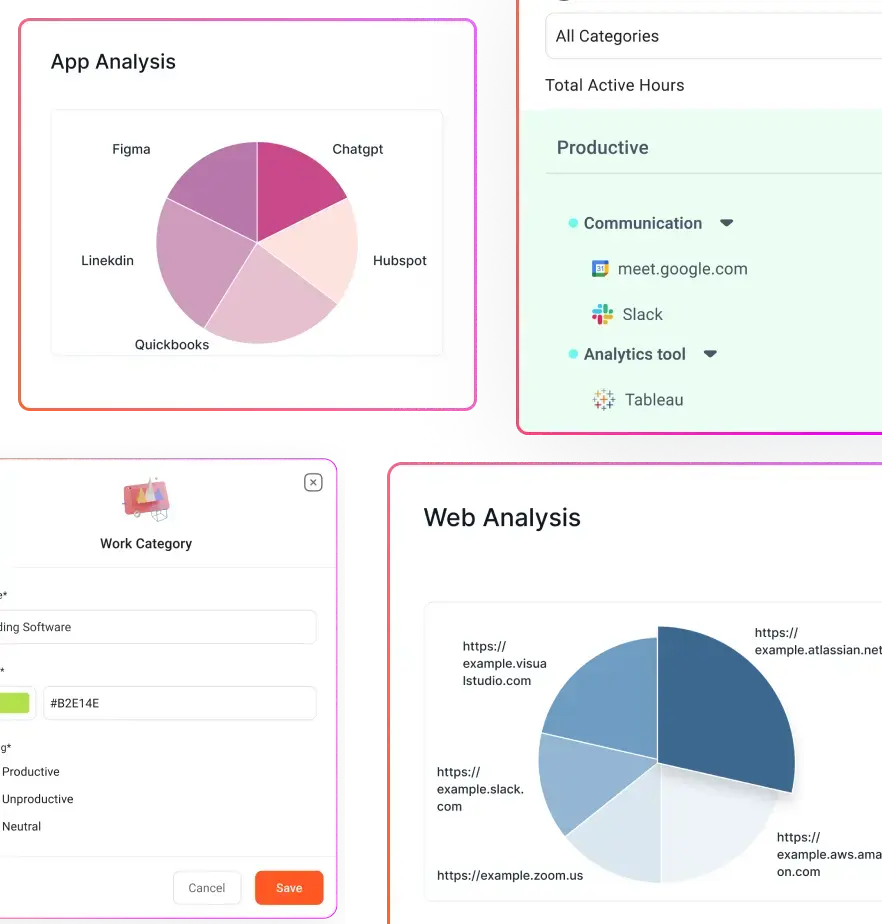
Tools like ActivTrak, Time Doctor, and DeskTime track digital activity and help managers ensure employees stay on task, especially when working remotely. They capture details like which apps are being used most, how long employees are spending on certain tasks, and which activities are taking up more time than expected.
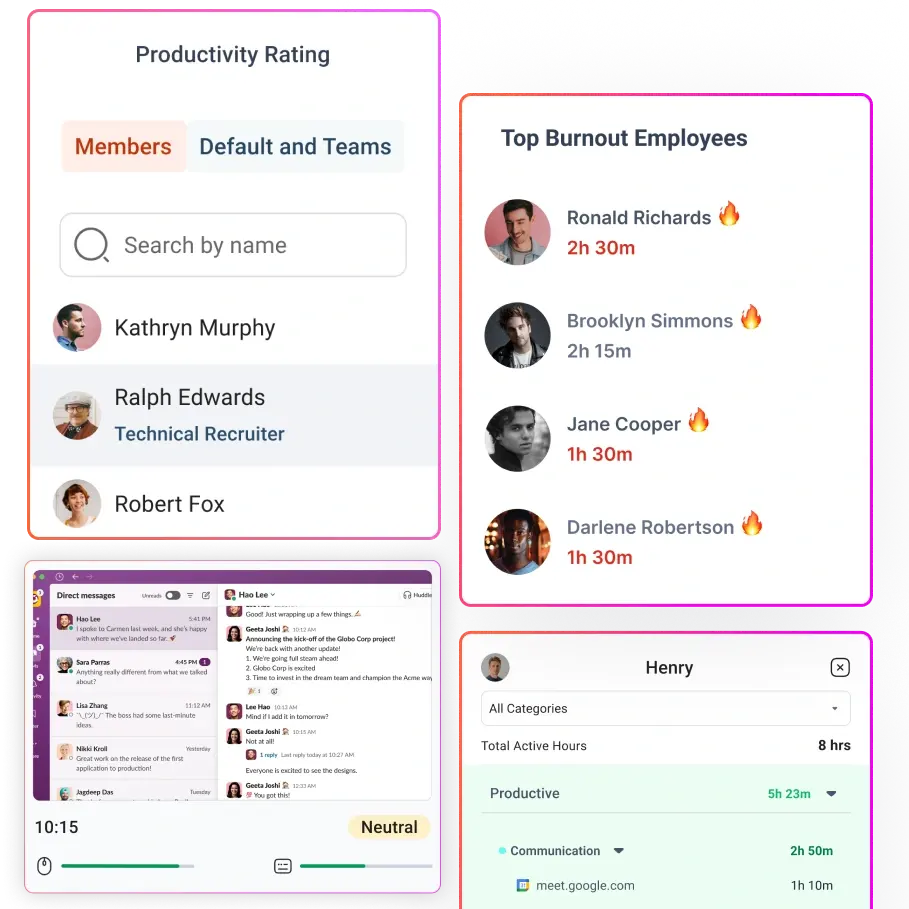
In a productivity dashboard, this data can be used to identify if someone is spending too much time on social media or chatting with coworkers during work hours. It could also highlight that certain employees are consistently logging long hours, which could indicate burnout or overwork.
When integrated into a productivity dashboard, employee monitoring tools give you a comprehensive look at individual and team productivity. You can see patterns emerge, like whether employees are prone to distractions or if certain tasks are taking longer than expected. It can also serve as a deterrent for time-wasting activities, as employees know they’re being monitored. More importantly, these tools can help you balance work allocation, ensuring that no one is overburdened while others are underutilized.
Best Practices for Implementing a Dashboard
- Before diving into building your productivity dashboard, take a step back and define your goals. What exactly do you want to track? Is it team productivity, time management, or task completion rates? Being clear about your objectives will help you choose the right tools and metrics to include in the dashboard.
- Picking the right tools is key. You need productivity software that integrates seamlessly with your existing systems and provides the features you need. Whether you’re using project management tools like Trello or Asana, time tracking software like Toggl, or employee monitoring tools like ActivTrak, make sure they play well together.
- A dashboard should be easy to understand at a glance. Avoid overwhelming users with too much information or unnecessary details. Focus on the key metrics that will help you make decisions, think of it like a snapshot of performance. Too much data can create confusion, so aim for clarity and simplicity.
- Get input from the people who will be using the dashboard, whether that’s managers, team leads, or employees. Involve them early in the design process to understand what data matters most to them. This will ensure your dashboard aligns with their needs and expectations.
- One of the biggest advantages of a productivity dashboard is that it can provide real-time data. This means that managers and team members can immediately see progress, identify problems, and act on them without delay.
- A productivity dashboard is even more effective when paired with automated alerts and notifications. You can set up triggers to notify you when certain thresholds are met, such as a task nearing its deadline, or when productivity dips below a certain level. These alerts can be sent via email or pushed to your dashboard, helping you stay proactive rather than reactive.
- Your dashboard shouldn’t be a “set it and forget it” tool. As business needs and team goals evolve, your dashboard should evolve too. Regularly review the data and update the metrics to ensure they still align with your objectives.
- While it’s important to gather data for improving productivity, it’s equally important to ensure the privacy and confidentiality of sensitive information. Make sure that your dashboard complies with data privacy laws and regulations.
- Lastly, regularly assess the effectiveness of your productivity dashboard. Are you hitting your initial goals? Is it helping teams stay productive and informed? Gather feedback from users and tweak the dashboard accordingly.
Addressing Challenges with Productivity Dashboards
1. Data Overload
One of the most common challenges with productivity dashboards is data overload. It’s easy to get carried away and add a ton of metrics to the dashboard, thinking that more data will provide a clearer picture.
But the reality is, that too much data can actually be counterproductive. When you have a dashboard filled with endless stats and figures, it becomes overwhelming. Users might feel lost trying to sift through all the information, and they may miss out on the critical insights that actually matter.
The key here is focus. It’s important to prioritize only the most relevant data points that align with your goals. For example, if you’re tracking employee productivity, focusing on task completion rates and time spent on tasks might be more useful than monitoring every single email opened or meeting attended.
2. User Adoption and Engagement
Introducing a new productivity dashboard to your team isn’t always a smooth ride. Even if it’s designed well, getting people to use it consistently can be a challenge. Some employees might feel hesitant about using the tool, especially if they don’t understand its value or feel it’s too complicated to navigate. It’s natural to encounter resistance to change, particularly if the team is used to managing tasks and tracking progress in a different way.
To overcome this challenge, it’s crucial to involve users early in the process. Engage your team in discussions about what they want from the dashboard and make sure it’s easy for them to use. Providing training and offering support can also ease the transition.
3. Keeping the Data Accurate and Up-to-Date
Another hurdle is ensuring the data being displayed on the dashboard is always accurate and up-to-date. Many dashboards pull data from various sources, project management tools, time-tracking software, employee monitoring systems, etc. If these systems aren’t properly integrated or if there are inconsistencies between them, the dashboard can quickly become unreliable. Outdated or inaccurate data can lead to poor decision-making and diminish trust in the tool.
4. Balancing Privacy and Transparency
When tracking productivity, there’s always a delicate balance between privacy and transparency. On the one hand, you want to track employee performance and project progress; on the other hand, you don’t want to overstep boundaries or create a culture of micromanagement. It’s a fine line to walk because, while data can help improve performance, excessive monitoring can lead to stress, disengagement, or even resentment.
To address this challenge, communicate openly with your team about the purpose of the dashboard. Explain that the goal is to improve efficiency, identify areas for support, and foster growth, not to monitor every minute detail of their work.
5. Maintaining Relevance as Goals Change
Your business and team goals will inevitably evolve over time, and this can present a challenge when it comes to keeping your productivity dashboard relevant. A dashboard that worked well for tracking certain metrics might not be as useful when your priorities shift or when new projects come into play. If the dashboard isn’t regularly updated to reflect new goals, it can quickly become outdated and lose its value.
To stay on top of this, schedule regular reviews of your dashboard to ensure it aligns with your current objectives. If you’re tracking project completion rates and those projects change, you’ll need to adjust your metrics accordingly. It’s also helpful to have flexibility in the dashboard’s design so that you can easily add or remove data points as needed.
6. Making It Actionable
Lastly, a productivity dashboard is only useful if the data leads to action. Simply having access to numbers and stats isn’t enough. The goal is to use those insights to drive decisions, make improvements, and take meaningful action. However, many teams struggle with interpreting the data and translating it into actionable steps.
To overcome this, make sure your dashboard includes not just the raw data, but also insights that can help drive decisions. For example, if you notice a dip in employee productivity, the dashboard could highlight the cause, perhaps it’s related to overwork or lack of resources. Provide actionable recommendations alongside the data, or even incorporate features like automated alerts that trigger specific actions when certain thresholds are reached.
How Flowace Helps in Productivity Dashboards?
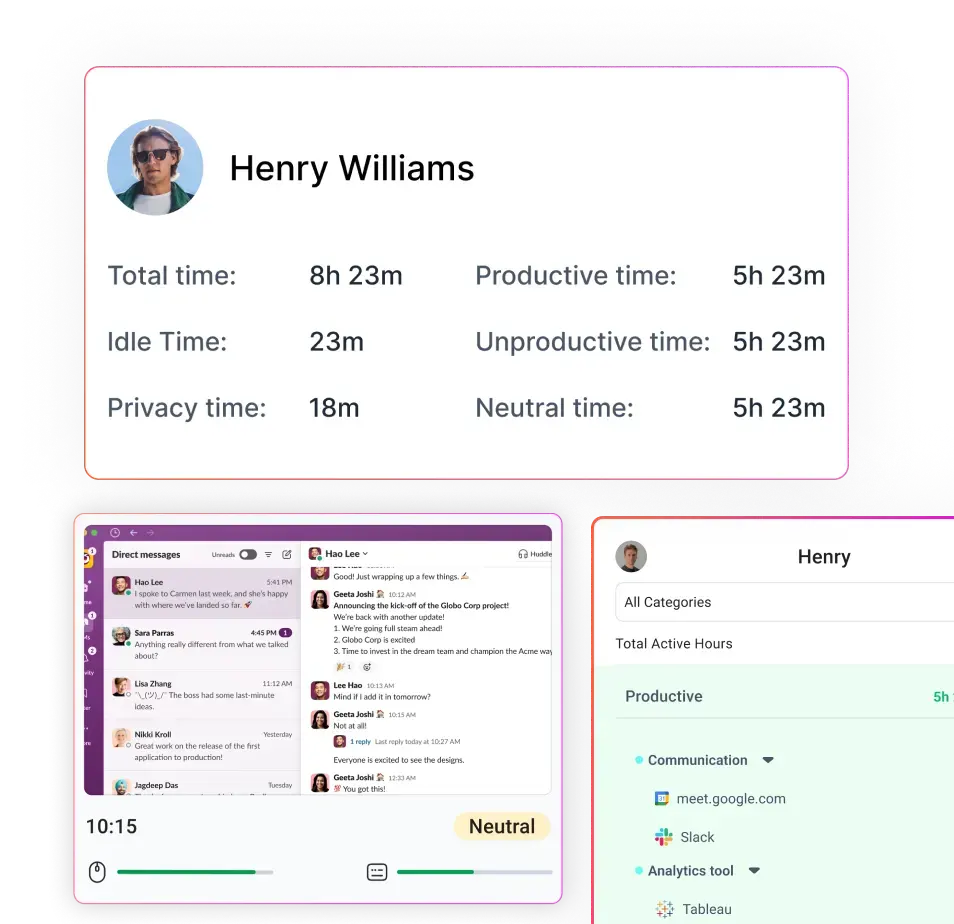
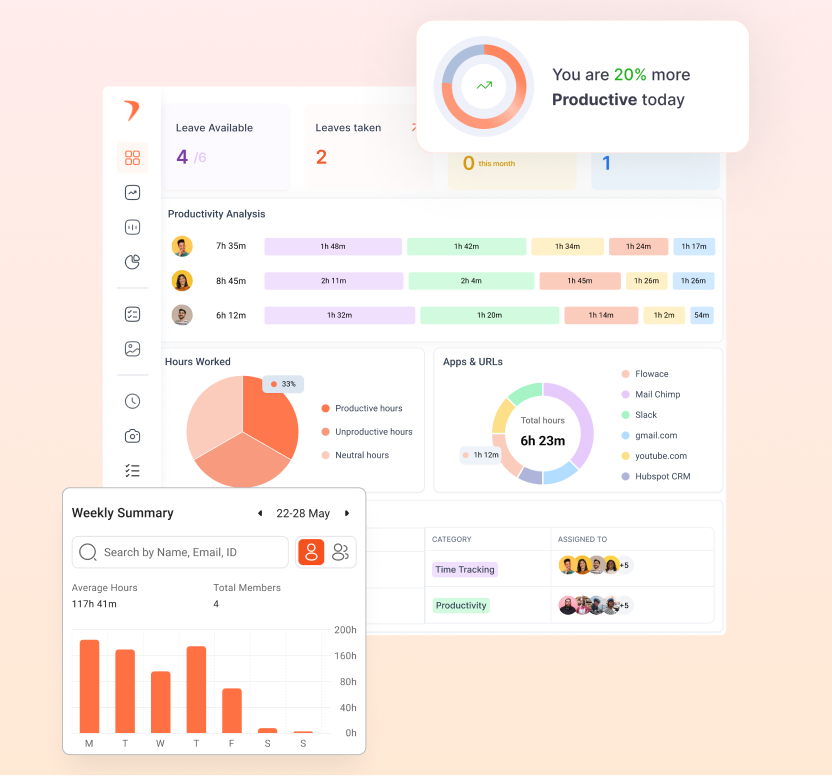
One of the main ways Flowace helps in creating effective productivity dashboards is through its time tracking and employee monitoring features. With Flowace, you can automatically track how much time employees are spending on different tasks, applications, or projects. This gives you an accurate picture of where time is being spent and allows you to pinpoint areas of improvement.
You can track the performance of individuals, teams, or even across the whole organization, and this data feeds directly into your dashboard. So, instead of relying on manual tracking, Flowace ensures that everything is automated and real-time, giving you the freshest and most accurate data.
Additionally, Flowace integrates with many popular tools and software, which means that the data can flow seamlessly from different platforms into your productivity dashboard. Whether it’s project management tools like Asana or Trello, communication platforms like Slack, or other productivity tools, Flowace consolidates everything into one unified view. This makes it much easier to see how different aspects of work are interconnected, giving you a holistic view of your team’s productivity.
Another feature of Flowace that enhances productivity dashboards is its focus on employee engagement and wellbeing. It doesn’t just track time; it also keeps an eye on things like idle time and helps you spot potential burnout before it becomes a bigger issue. For example, if an employee is spending too much time on unproductive tasks or experiencing consistent periods of inactivity, Flowace can alert you. This insight allows managers to intervene early and support their teams before small issues escalate into more significant problems.


