Best PC Monitoring Software: CPU, GPU & System Health in 2026

Whether you manage office desktops or push your gaming rig to its limits, you need a clear view of what’s happening under the hood. Task Manager is helpful, but it won’t show you full sensor data or early warning signs.
PC monitoring software fills that gap with real-time CPU and GPU temps, clock speeds, fan RPM, RAM usage, and disk health.
In this guide, we’ll cover the 10 best PC monitoring tools, their key features and pricing, and what to look for when you choose one.
Key Takeaways:
-
PC monitoring software goes beyond Task Manager — it tracks CPU, GPU, RAM, and storage health in real time to prevent overheating, throttling, or hardware damage.
-
CPU and GPU temperatures are critical metrics — safe ranges are ~30–50 °C at idle and 60–85 °C under load; consistently higher temps signal risk.
-
System-wide monitoring matters — RAM usage, disk S.M.A.R.T. data, and motherboard voltages help catch failures and bottlenecks early.
-
Top tools serve different needs — HWiNFO, MSI Afterburner, NZXT CAM, and HWMonitor work well for individuals, while AIDA64, NinjaOne, Zabbix, and Prometheus are better for IT and enterprise use.
-
Ease of use vs. depth of data — some tools are lightweight and beginner-friendly, while others provide professional-grade diagnostics and analytics.
-
Monitoring prevents common failures — early alerts can help fix overheating, unstable voltages, faulty fans, or failing drives before they cause crashes.
-
Choosing the right tool depends on your goal — gamers may need overlays and fan control, casual users benefit from simple dashboards, and IT admins need scalable monitoring with alerts and reporting.
PC Monitoring Software: Comparison Table for the Top 10 Tools
| Tool | Best For | Key Features | Pros | Cons | Pricing |
|---|---|---|---|---|---|
| HWiNFO | Power users, diagnostics | Full hardware analysis, real-time monitoring, reports, alerts, integrations | Accurate, updated, privacy-friendly | Complex UI, steep learning curve | Free (Pro for commercial use) |
| MSI Afterburner | Gamers, GPU overclocking | GPU/VRAM overclocking, FPS & temp overlay, fan control, benchmarking | Great for overclocking, free, real-time stats | Risky if misused, may void GPU warranty | Free |
| NZXT CAM | Casual users, NZXT gear owners | CPU/GPU monitoring, in-game overlay, fan & RGB control, mobile app | Modern UI, cloud sync, device integration | Advanced features need NZXT hardware | Free |
| HWMonitor | Quick checks, lightweight use | Real-time temps, voltages, fans, battery, logging | Simple, fast, remote monitoring (Pro) | Outdated UI, lacks stress tests | Free / Pro (paid) |
| AIDA64 Extreme | Enthusiasts, professionals | Diagnostics, stress testing, benchmarking, custom reports, SensorPanel | Extremely detailed, pro-level accuracy | Paid only, may overwhelm casual users | Paid (license, free trial) |
| NinjaOne | IT admins, MSPs | Remote monitoring, patch mgmt, alerts, asset tracking, endpoint security | Easy UI, scalable, great support | Quote-based, extra modules cost more | Custom ($2–$4/endpoint/mo) |
| Zabbix | Enterprises, network monitoring | Server/network/cloud monitoring, customizable alerts, dashboards, integrations | Open-source, scalable, no per-device fees | Steep setup curve, older UI | Free (paid support optional) |
| ESET SysInspector | Security-focused troubleshooting | Process/driver/network scan, rootkit detection, risk ratings, log compare | Portable, free, malware/rootkit detection | Windows-only, basic interface | Free |
| ScanCircle | Everyday PC users | Online scan of OS, drivers, security, hardware, updates | No install, fast, privacy-friendly | Not as deep as installed tools | Free |
| Prometheus | DevOps, cloud-native monitoring | Time-series metrics collection, alerts, API-driven, Grafana dashboards | Free, scalable, flexible, great for containers | Needs Grafana for visualization, setup complexity | Free (open-source) |
What are the Core Hardware Metrics You Need to Track in a PC Monitoring Software?
To keep your PC fast and stable, you need your PC monitoring software to watch a few core signals. Track these, and we can catch heat spikes, throttling, and failing parts before they become major issues.
CPU Monitoring:
You want a clear view of each core’s temperature, clock speed, use, and any throttling. At idle, most CPUs sit around 30 to 50 °C. Under heavy loads like gaming or rendering, they often climb to 60 to 85 °C. If temperatures stay near 90 to 100 °C, the chip can throttle or even get damaged.
Good PC monitoring software like HWiNFO or HWMonitor charts load and temperature in real time and keeps logs, so we can spot trends. You can even set alerts when a core crosses a safe limit.
Also, watch voltage and CPU power draw. Wild voltage swings can point to power delivery issues or a bad BIOS setting.
GPU Monitoring:
Your graphics card needs the same care. Track its temperature, usage, and clock speeds. A GPU at idle or on light work is usually 30 to 40 °C. Under full load it often lands between 65 and 85 °C.
Modern cards can handle high temps for short bursts, but living at the limit can shorten life. If you are using PC monitoring software like MSI Afterburner or NZXT CAM, it shows you live curves for temperature and utilization. If you overclock, keep an eye on power draw and VRAM use.
Fan control matters a lot. Tuning fan curves in software helps you keep heat in check when games or renders push the card hard.
System Health Indicators:
Do not forget the rest of the system. Use PC monitoring software to keep an eye on RAM use so you are not paging to disk all day. Watch storage health with S.M.A.R.T. data.
Growing bad sectors or very slow reads often warn of a drive on its way out. Check motherboard sensors for chipset temps and key voltages to catch cooling or PSU strain early.
Some monitors can also show network throughput. That helps you spot a noisy app or a rogue process that is stealing your bandwidth.
Top 10 PC Monitoring Software
The right PC monitoring software gives you real-time insights into temperature, voltage, usage, and performance. Here’s a quick look at the top 10 hardware monitoring tools to keep your computer running smoothly.
HWiNFO
HWiNFO gives you everything you need to understand your computer inside and out. You can check every part of your system, from the CPU and GPU to drives and peripherals. We help you watch performance in real time, spot problems early, and keep your PC stable. It’s perfect for diagnostics, monitoring, and detailed reports.
Key Features
- In-depth hardware analysis
- Real-time system monitoring (CPU, GPU, RAM, drives, motherboard)
- Extensive reporting (XML, CSV, HTML formats)
- Customizable alerts
- Integration with other tools
Pros
- Accurate, up-to-date hardware information
- Frequent updates
- No data collection or transmission for privacy
Cons
- May be overwhelming for non-technical users
- User interface is complex
Pricing
- Free for most usage
- Paid Pro version for commercial use
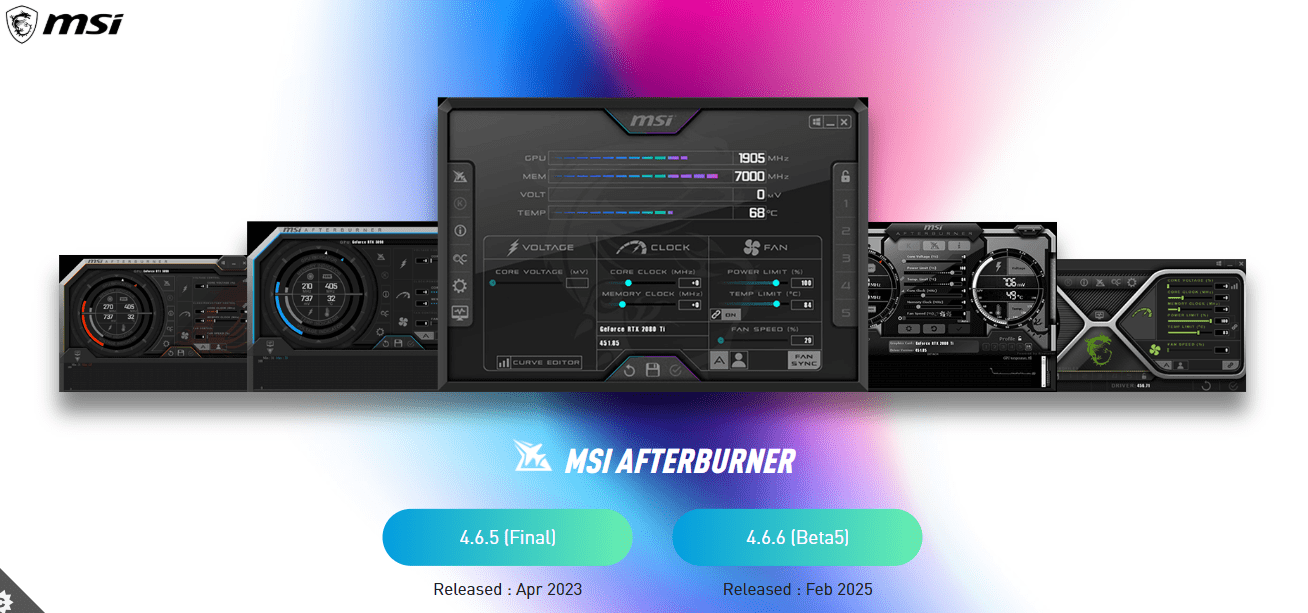
MSI Afterburner
MSI Afterburner lets you take full control of your graphics card. You can adjust speed, voltage, and fan settings to get the best performance. We also give you a live overlay with FPS, temps, and usage while you play. It’s the go-to tool if you want safe overclocking and real-time gaming stats.
Key Features
- GPU and video memory overclocking
- Real-time monitoring (FPS, temperature, usage)
- Fan speed control
- Benchmarking tools
- Customizable profiles
Pros
- Broad hardware compatibility
- Comprehensive real-time game overlay
- Free to use
Cons
- Overclocking can void GPU warranty
- Risk of hardware damage if misused
Pricing
- Free
NZXT CAM
NZXT CAM makes it easy to keep an eye on your PC and control your setup. You can track CPU and GPU stats, watch temps, and use in-game overlays. We give you simple controls for fans and lighting, plus remote access through the cloud. It’s your all-in-one hub for managing NZXT gear and PC health.
Key Features
- Real-time CPU/GPU monitoring
- In-game overlay
- Custom fan profiles
- Overclocking support
- Device and lighting management
- Mobile app for remote monitoring
Pros
- Intuitive, modern interface
- Good integration with NZXT devices
- Free and cloud sync features
Cons
- Some advanced features require NZXT hardware
- User data handled via the cloud
Pricing
- Free
HWMonitor
HWMonitor helps you keep track of your PC’s health in real time. You can see temps, voltages, and fan speeds across your CPU, GPU, drives, and even the battery. We make it simple and lightweight, so you get clear readings fast. It’s perfect if you want quick checks to prevent overheating and keep things stable.
Key Features
- Real-time CPU, GPU, motherboard, and drive temperature monitoring
- Fan speed, voltages, power, clock speeds
- Battery and network status
- Logging and customizable interface
Pros
- Simple and lightweight
- Supports remote monitoring (Pro version)
Cons
- Lacks benchmarking and stress tests
- UI is basic and sometimes outdated
Pricing
- Free version available
- Pro version (for remote monitoring, paid)
AIDA64 Extreme
AIDA64 Extreme gives you deep insight into your PC or mobile device. You can run diagnostics, check sensors, and test hardware with ease. We also provide stress tests and benchmarking tools to push your system and measure performance. It’s a trusted choice for pros and overclockers who need detailed data and reliable testing.
Key Features
- Hardware detection and detailed info
- Diagnostics, stress testing, benchmarking
- Sensor monitoring (temperature, voltage, fan speed)
- Reporting, SensorPanel, external display support
Pros
- Extremely comprehensive and accurate
- Customizable reports and alerts
- Suitable for PC enthusiasts and professionals
Cons
- Paid software
- May be overkill for basic users
Pricing
- Paid (license-based; free trial available)
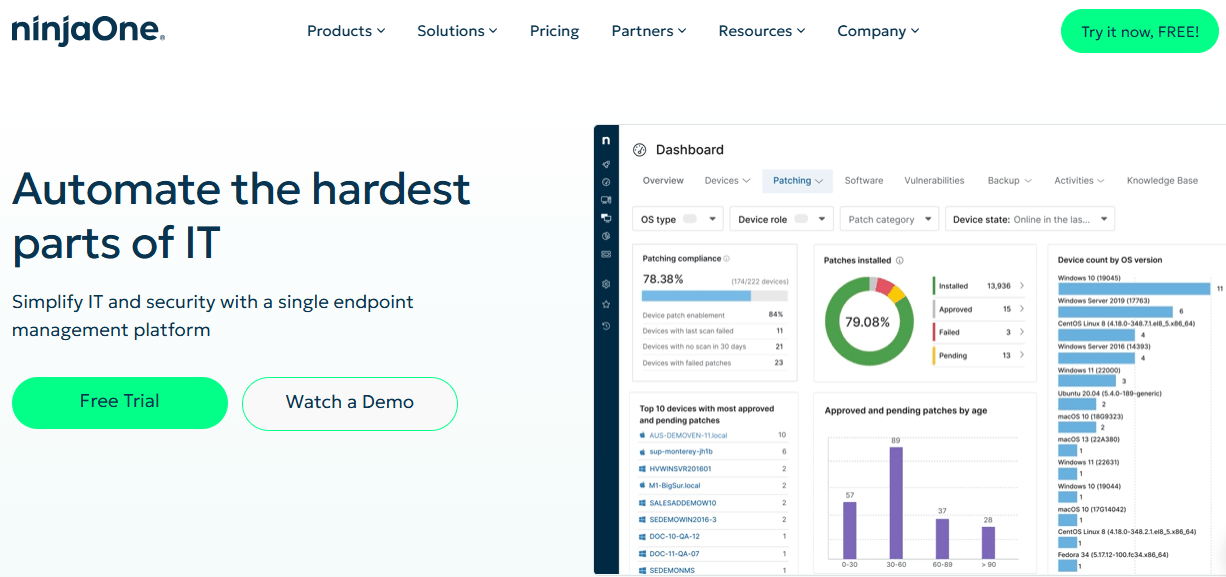
NinjaOne
NinjaOne helps you keep your servers healthy and running smoothly. You can track uptime, performance, and system health across both macOS and Windows. We give you real-time alerts so you can fix issues before they grow. Built for IT teams, it makes managing infrastructure simple and reliable, even when your teams are spread out.
Key Features
- Real-time server health and performance monitoring
- Remote device management
- Automated patch management
- IT asset inventory and tracking
- Alerting and reporting
- Endpoint security integrations
Pros
- Intuitive, easy-to-use interface
- Scalability and modular add-ons
- Free onboarding, training, and ongoing support
- Flexible per-device pricing
- Suitable for both internal IT teams and managed service providers
Cons
- Pricing is quote-based and not fully transparent
- Some advanced modules incur additional costs
- May be complex for very small organizations
Pricing
- Custom pricing; typically $2–$4 per endpoint per month, with volume discounts
- Free 14-day tria
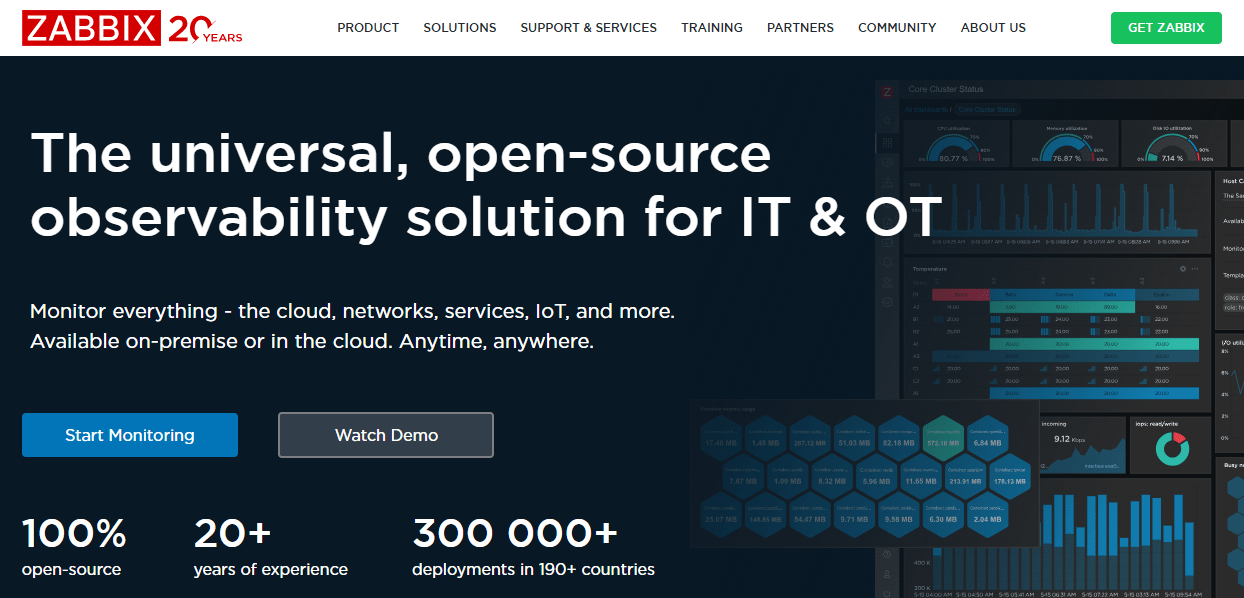
Zabbix
Zabbix gives you a powerful way to monitor networks, servers, cloud, and apps in one place. You can collect and store system metrics, then visualize performance and uptime with ease. We built it to scale, so it works well for large teams. If you need flexible, enterprise-grade monitoring, Zabbix is a trusted open-source choice.
Key Features
- Comprehensive network and server monitoring
- Data collection via agents or agentless methods (e.g., SNMP, IPMI)
- Customizable alerts and notifications
- Powerful visualization (graphs, dashboards)
- Integration with many third-party platforms (Grafana, Slack, Telegram)
- Role-based access for teams
Pros
- Free and open-source with no per-device charges
- Highly scalable for large, distributed environments
- Flexible integration and data collection options
Cons
- Requires setup and configuration expertise
- UI less modern than some commercial alternatives
- Advanced features may need customization
Pricing
- Free for software; paid support plans available for enterprises
- No license or per-device fees
ESET SysInspector
ESET SysInspector helps you troubleshoot your system with ease. You can scan running processes, services, drivers, and network connections to spot issues. We highlight suspicious files and assign risk levels so you know what to fix first. It’s a free tool that makes system maintenance and threat detection simple for anyone looking to stay secure.
Key Features
- System snapshot and log generation
- Scans running processes, drivers, network connections, and the registry
- Color-coded risk levels for prioritized troubleshooting
- Integrated with ESET’s anti-stealth technology for rootkit detection
- Log comparison for tracking system changes
Pros
- Simple, portable, no install required
- Powerful for rootkit/malware detection
- Free standalone or within ESET security products
- Good for IT experts and first responders
Cons
- Windows-only (no native Mac/Linux support)
- Basic UI
Pricing
- Free
ScanCircle
ScanCircle makes it easy to check your computer for common problems. You don’t need to install anything, just run the scan online. We look at hardware, OS health, security, drivers, and updates. Then we give you clear advice on what to fix. It’s fast, simple, and private, designed to keep your PC running smoothly.
Key Features
- Web-based (no installation needed)
- Scans OS health, security, hardware, updates, and drivers
- Offers clear, actionable advice based on scan results
- Preserves privacy; lightweight and fast
Pros
- Free and simple to use
- Privacy-friendly (no installation, minimal personal data)
- Good for everyday troubleshooting
Cons
- Not as in-depth as dedicated desktop diagnostic applications
- Limited advanced monitoring features
Pricing
- Free
Prometheus
Prometheus helps you track metrics at scale in cloud and Kubernetes setups. You can collect system and app data, store it as a time series, and run flexible analysis. We also give you smart alerting so you stay ahead of issues. Pair it with Grafana, and you get custom dashboards to visualize everything with ease.
Key Features
- Collects and stores metrics as time series data
- Powerful query and analysis engine
- Custom alerting rules
- Integrates with Grafana for advanced dashboards
- Flexible, API-driven architecture
Pros
- Free, open-source
- Built for horizontal scalability and cloud-native infrastructure
- Excellent for microservices and containers
- Highly flexible and extensible
Cons
- May require expertise to set up and operate
- Not an all-in-one monitoring solution (requires Grafana and integrations for visualization)
Pricing
- Free (open-source)
How to Choose the Right PC Monitoring Software?
When picking a monitoring tool, align it with your goals:
- Ease of Use & Deployment: If you’re a non-technical user, choose something with a simple setup (NZXT CAM, MSI Afterburner). Network/cloud tools (PRTG, AIDA64’s cloud options) require more effort but scale to many machines.
- Data Collected: Make sure the tool tracks the metrics you need (CPU/GPU temp, RAM, disk, network). Also consider how often it polls data (real-time vs. periodic).
- Alerting & Notifications: If you need proactive warnings, check that the software can send email/SMS alerts or pop-ups when values exceed thresholds.
- Reporting & Analytics: Some tools just show live stats, while others create logs, trends and exportable reports. If compliance or historical analysis is important, pick a tool with strong reporting (AIDA64, PRTG, Flowace).
- Privacy & Transparency: In an office environment, use tools with privacy controls (anonymized logs, permission settings) to stay ethical and legal.
- Virtual Private Network (VPN) : A Virtual Private Network (VPN) creates a secure, encrypted tunnel for your internet traffic, masking your IP address and protecting your data from your ISP, hackers, and government surveillance. It allows you to bypass geographical restrictions. The keyword you asked about, what is a mobile vpn, refers to a VPN that maintains this secure connection even as your device moves and switches between different network types (like Wi-Fi and cellular data) without interruption.
- Support & Community: Well-documented tools and active forums help when troubleshooting. Check user reviews for vendor support quality.
- Cost vs. Budget: Many powerful hardware monitors are free or one-time purchases (HWiNFO, Afterburner, HWMonitor, CAM). Enterprise products (AIDA64, PRTG, Flowace) may require licenses/subscriptions. Consider the total cost of ownership (software fees plus admin effort).
What are the Common Hardware Issues that Occur in a PC Monitoring Software?
PC monitoring software helps you catch problems early. Regularly reviewing your monitor’s data can guide maintenance. For instance, a gradually rising idle temperature might hint at dust buildup, prompting cleaning.
Some frequent issues and fixes include:
- High CPU/GPU Temperatures: Check that coolers/heatsinks are seated properly and fans are spinning. Ensure thermal paste is applied correctly. Improve case airflow or reduce overclocks. A fan curve (set in BIOS or software) can ramp fans under load.
- Unusual Fan Behavior: If a fan stops or is unusually loud, replace it. Use monitoring to catch failed or stuck fans quickly.
- RAM or Disk Saturation: If RAM is constantly maxed out, close background apps or add more RAM. For disks, run S.M.A.R.T. diagnostics – replace HDD/SSD if errors increase.
- Voltage Fluctuations: Erratic voltages can cause instability. Check the power supply and motherboard VRMs. Use BIOS updates or replace faulty PSU.
- System Crashes / Thermal Throttling: When temperatures hit critical levels, the CPU/GPU will throttle or shut down. Monitoring alerts let you intervene (e.g. lower settings, improve cooling) before it happens.
- Overclock Instability: If an overclocked system crashes under stress test, revert to safe defaults. Use the monitoring logs (spikes in temp or voltage) to guide a conservative clock.
Final Thoughts
The best PC monitoring software depends on what you need. If you want to prevent overheating and boost performance, tools like HWiNFO, MSI Afterburner, HWMonitor, or NZXT CAM are great choices. They keep you updated on CPU and GPU health so you can act fast.
For managing many systems, pro tools like AIDA64 or Paessler PRTG work better. No matter what you pick, the goal is simple. We want to keep your system healthy, spot issues early, and avoid downtime.