In business, understanding how work gets done is as important as the work itself. Whether leading a startup or managing a large team, tracking productivity is essential to ensuring everyone is moving toward the same goal.
However, not all measures of productivity are obvious. Instead of just counting hours worked, smart leaders look to specific metrics and KPIs to assess efficiency and impact.
In this blog, we’ll walk through 15 Productivity Metrics and KPIs that can help you understand where your team excels and where there’s room for improvement.
Key takeaways:
-
Productivity is about quality output, not just hours worked – True productivity measures the meaningful results achieved with available resources, not simply the amount of time spent.
-
Metrics and KPIs give clarity and direction – Tracking the right productivity metrics helps identify strengths, weaknesses, and areas for improvement, enabling data-driven decision-making.
-
Choose metrics aligned with business goals – Effective productivity measurement requires selecting KPIs that directly reflect company objectives and are tailored to different teams or roles.
-
A mix of quantitative and qualitative indicators works best – Combining output measures (e.g., sales closed, tasks completed) with qualitative metrics (e.g., customer satisfaction, employee engagement) provides a fuller picture of performance.
-
Technology can streamline productivity tracking – Tools like Flowace automate time tracking, monitor KPIs, and provide dashboards for real-time insights, making measurement more accurate and less intrusive.
-
Measurement should drive improvement, not surveillance – Productivity tracking is most effective when it supports alignment, coaching, and continuous growth rather than simply policing employees.
What Is Productivity?
To fully grasp the importance of tracking productivity, we must first define what productivity means in a business context.
Business productivity is a measure of how effectively a firm, department, or employee generates goods and services. It is calculated by comparing the quantity of resources, such as time and technology, used to produce an output with the quantity of output that is generated.
Productivity is an important measure of a company’s economic success and competitive advantage. Businesses with productive workforces typically see a rise in earnings, improved employee retention, and decreased operating costs.
Now that we understand productivity, we can explore the specific metrics that help us measure it effectively.
What Are Productivity Metrics?
Productivity metrics examine how employee actions impact the organization’s objectives and performance across a range of domains.
Measuring employee productivity offers valuable data for monitoring, overseeing, and assisting with the work of your staff members.
Productivity metrics can assist companies in pinpointing areas for improvement to boost productivity and effectiveness. For instance, a company can monitor the percentage of tasks allocated vs. completed to gauge how effectively its staff is carrying out plans.
Productivity metrics should offer employers the confidence to make decisions that improve both their firm and their employees’ well-being.
Understanding these metrics raises an important question: why is it crucial to measure productivity in the first place?
Why Should You Measure Productivity?
Measuring productivity isn’t just a box to check—it’s critical for improving efficiency and optimizing workflows. When you track productivity metrics, you gain valuable insights into team performance, identify bottlenecks, and make data-driven decisions.
You can see where time is being spent, how resources are being utilized, and where your organization can save time or money.
Some benefits include:
- Higher revenue with fewer resources.
- Meeting or exceeding performance targets.
- Smarter project scheduling and resource allocation.
- Identifying areas for training and development.
With the reasons for measurement established, let’s look at how to measure and track these productivity metrics.
How Do You Measure Productivity?
One way to calculate productivity is to divide total outputs by total inputs, although this is merely a general formula that doesn’t account for specific company needs. Utilizing the output/input paradigm to measure productivity is rarely straightforward for the majority of businesses.
The fact that various businesses have diverse aims is reflected in the range of Employee Productivity Tracking Software and strategies that are employed. Productivity measurement is essentially a three-step procedure. A company must select the productivity measures that correspond with its objectives.
Second, companies must compute those measures related to productivity. Businesses must measure and evaluate productivity in addition to taking into account the well-being of their workforce, as making sure that workers feel valued and acknowledged is crucial to their success.
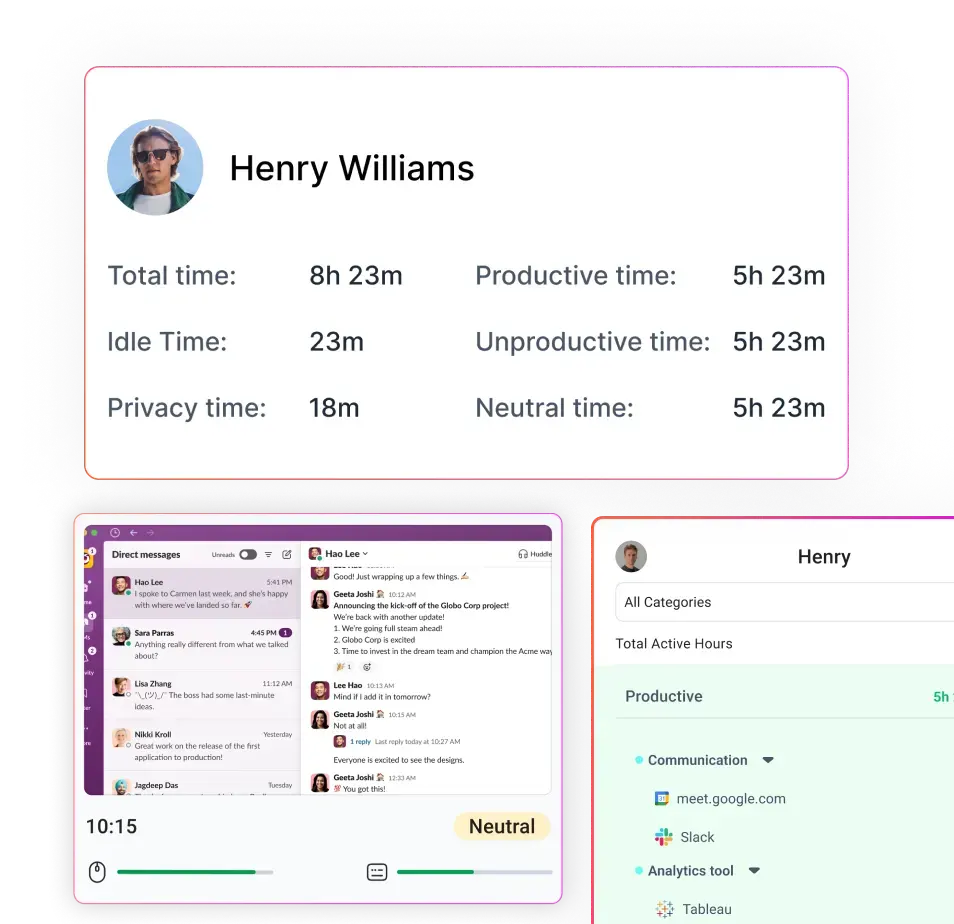
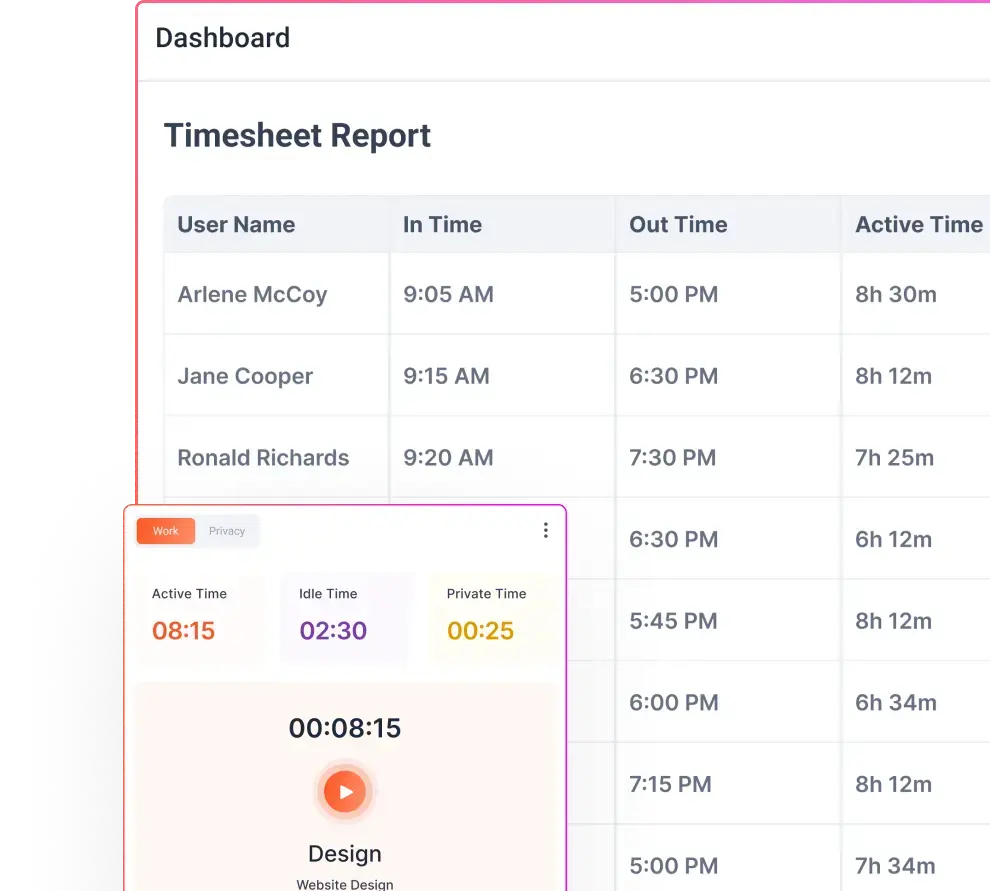
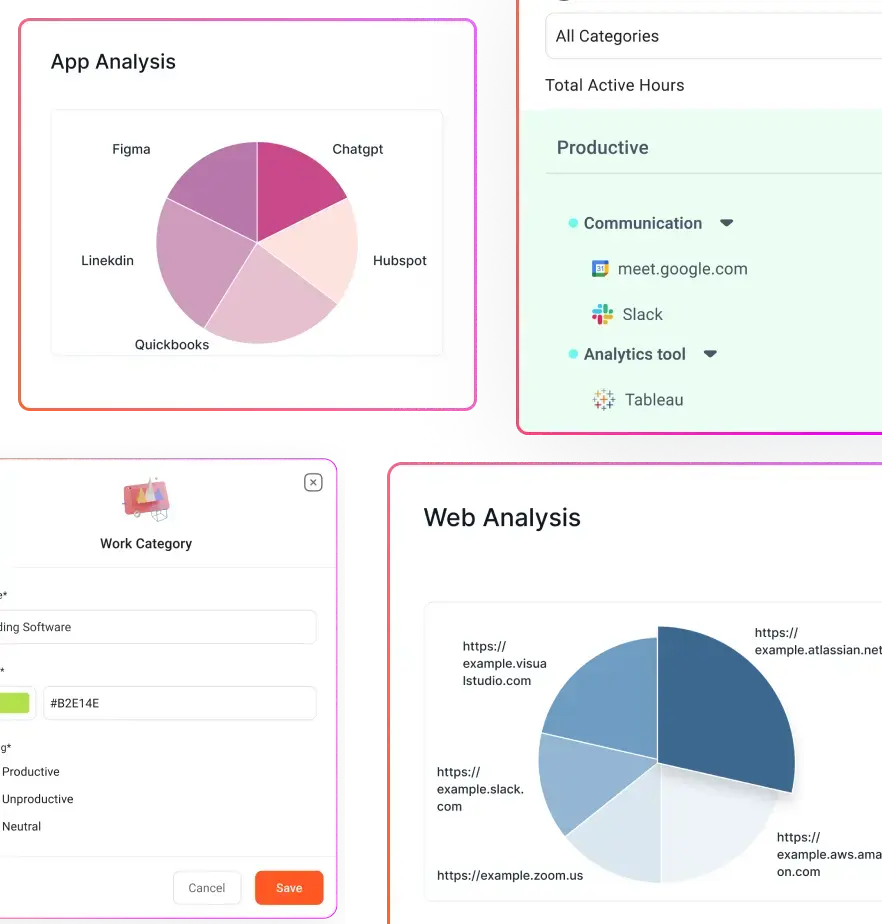
One effective way to calculate productivity is by utilizing productivity tracking tools like Flowace, which provide detailed insights into how time is allocated across different tasks. This allows businesses to assess productivity levels accurately and adjust their strategies accordingly.
Let’s dive deeper into the specific metrics and KPIs that can make a significant difference in your organization’s productivity.
Why Is Productivity More Important Than Time?
There is a deep relationship between productivity and hours worked. To understand the concept, think of what defines productivity. It is the meaningful, quality work that generates the desired result.
Hours worked is just a metric that defines how long an employee has worked in the day. An employee can achieve the same result in less time by being more productive.
The typical 40-hour workweek has conditioned many corporate leaders to assume that working longer hours equates to producing more. But that’s not always the case.
The balance of productive time, or when a team member is genuinely involved in their job and capable of doing tasks efficiently, is crucial to comprehending the link between productivity and hours spent.
Productivity Metrics Examples
When you start tracking productivity, the first thing you’ll realize is that there’s no single “magic number” that tells you how well your business is doing. Productivity is a blend of operational speed, financial results, customer happiness, and team engagement — and each of these can be measured in its own way.
For instance, Employee Turnover Rate is a big one. If people are leaving faster than you can replace them, it’s a sign that something deeper is going wrong. Maybe it’s culture, maybe it’s workload, or maybe your onboarding isn’t setting people up for success. Keeping an eye on turnover gives you an early warning before it starts affecting morale or performance.
Then there’s the Task Completion Rate, which is as straightforward as it sounds. Out of all the tasks your team commits to, how many actually get done on time? This simple percentage can uncover bottlenecks, help rebalance workloads, or highlight where processes need streamlining.
If you want to connect productivity directly to financial outcomes, Revenue per Employee is a telling metric. It shows how much income each person on your team is contributing. A rising figure here means your team is not only working hard but also working smart — delivering more value without necessarily adding headcount.
Customer experience also tells you a lot about productivity. The Customer Satisfaction Score (CSAT) isn’t just about keeping people happy; it’s about understanding whether your team can deliver quality work efficiently enough to meet or exceed expectations. A high CSAT means your processes are smooth and your team is in sync.
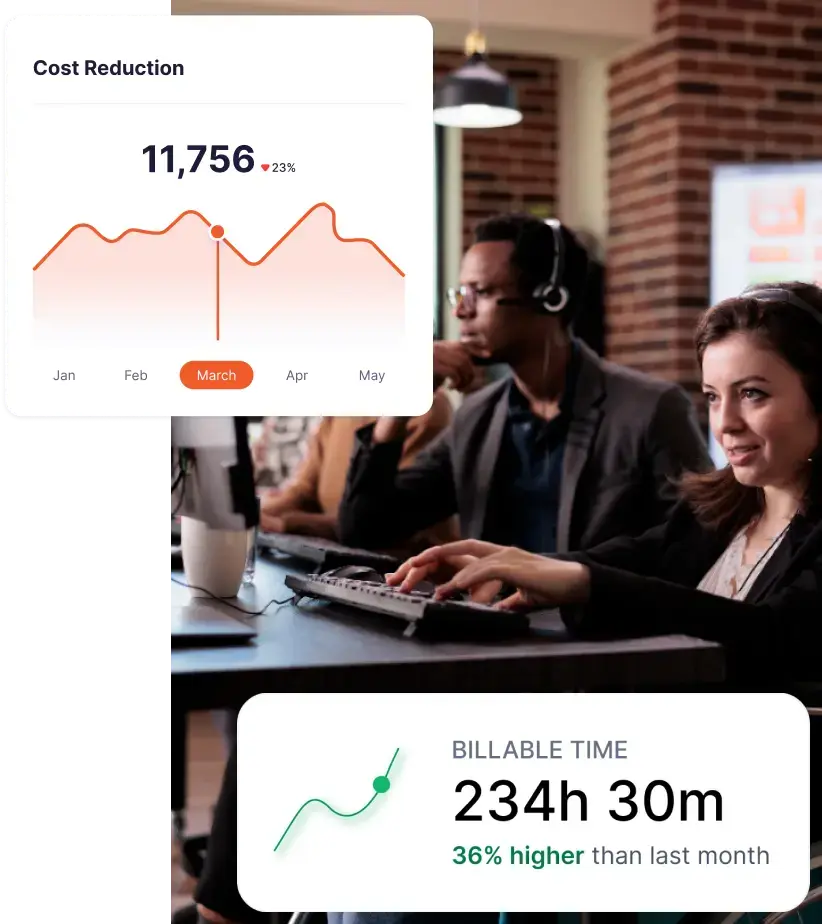
In service-based industries, Billable vs. Non-Billable Hours is key. It’s the ratio between the time spent on work that clients pay for and the time spent on internal activities like meetings or admin. A healthy balance means your team is spending the majority of their time on revenue-generating work without burning out.
On the operational side, Cycle Time is another great indicator. It tracks how long it takes to complete a task or project from start to finish. Shorter cycle times mean you’re turning work around quickly and freeing up capacity for more projects — a huge competitive advantage.
You might also look at your Goal Conversion Rate — how many of your planned objectives actually get delivered on time. This is different from task completion, because it’s about hitting strategic milestones rather than just ticking off to-do lists.
Finally, there’s Employee Utilization Rate, which shows how much of someone’s working time is actually spent on productive, value-adding work. It’s a good check to make sure no one is overloaded — or underused — and that you’re getting the most from your team without pushing them to exhaustion.
The beauty of these metrics is that they don’t work in isolation. They connect with each other. If turnover is low, completion rates are high, and customers are happy, you’re likely seeing strong revenue per employee and healthy utilization rates. That’s when you know you’ve hit the sweet spot — a team that’s both productive and sustainable.
What Productivity Metrics Should You Measure?
While deciding on which productivity metrics to measure, it is important to self-reflect on factors such as your employee hierarchy, time, and the probable results of different actions. Here are a few considerations that you can make while choosing the right productivity metrics:
1. Look at productivity from different angles
To truly understand productivity, try looking at it from multiple perspectives. Start by considering how efficiently things get done—think about factors like weekly output or how quickly projects are completed.
Then, broaden your view to include customer and employee engagement. Metrics like customer retention rates or employee satisfaction scores can reveal how well your team connects with both clients and staff, giving insight into productivity that’s about more than just numbers.
2. Link productivity to your business goals
The metrics you choose should reflect what matters to your business. Pick productivity indicators that tie directly to your company’s mission—this will keep you focused on what’s truly impactful.
It can also help to map each process or metric to specific objectives. As you do this, communicate the alignment to your team so they understand how their roles support the big-picture goals.
3. Define productivity in ways that make sense for each team
Productivity can look different depending on the team and industry. Get specific about what it means for each group in your organization.
For example, your performance marketing team might focus on metrics like the number of leads generated, while the IT team could track the number of system upgrades or feature releases.
Clearly define these expectations across departments so everyone has a shared focus that ties back to the goals you’ve set.
4. Track your progress with a KPI dashboard
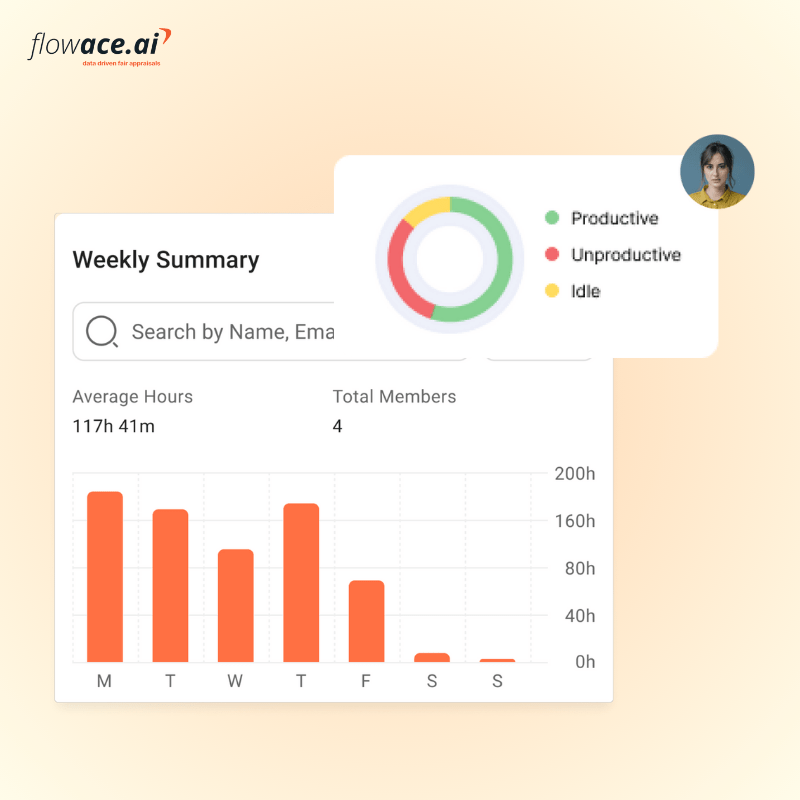
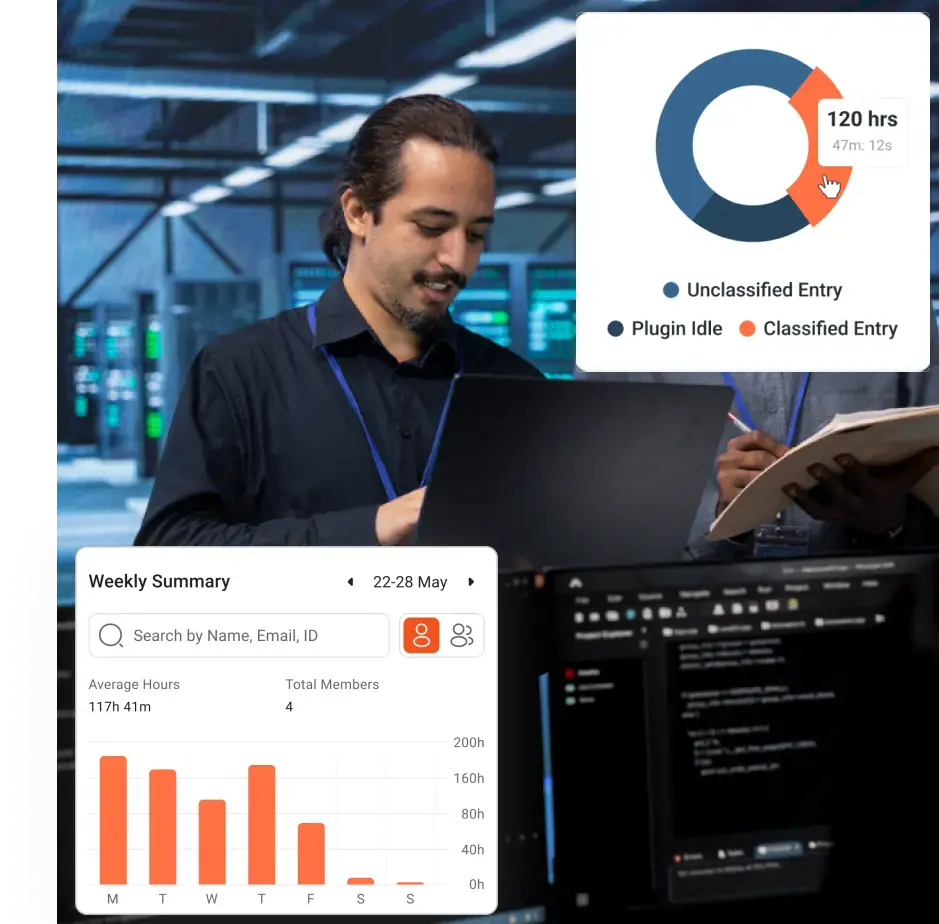
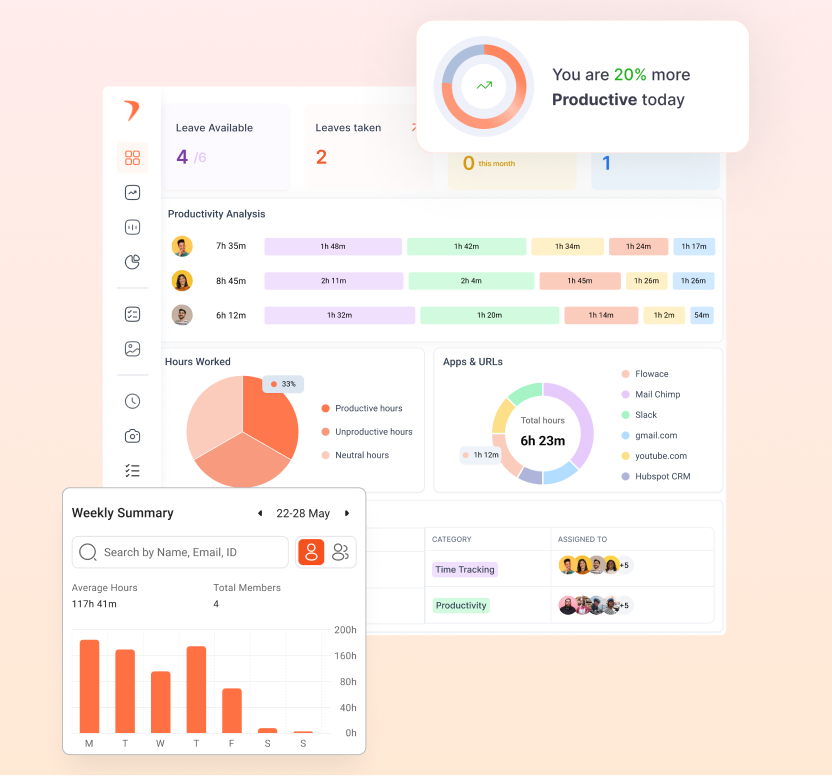
A good KPI dashboard can be a game-changer for keeping productivity metrics visible and easy to understand. With a customizable dashboard, you can quickly get a snapshot of how teams are performing over time or on specific projects.
Dashboards also help make data accessible for stakeholders, providing real-time insights in a way that’s easy to digest. For a comprehensive view, include both leading indicators (predictive) and lagging indicators (historical) to see both where you’re headed and how far you’ve come.
Gain clarity and control over team performance with Flowace’s KPI dashboard. Track critical metrics, uncover trends, and make informed adjustments—all in one place for a smarter approach to productivity.
What Can You Learn From Measuring Productivity?
Measuring productivity is an important step towards increasing your company’s profits. Comparing your productivity to your competitors lets you determine which areas may best increase company performance.
Generally speaking, it should be simpler to advance if there is a greater production difference between you and your competitors in a certain field. Productivity measurement helps prioritize areas for development in addition to recognizing them.
Additionally, by tracking your department’s or company’s productivity, you may make necessary adjustments to fulfill deadlines, such as hiring more staff or purchasing equipment.
Understanding your workforce’s productivity also helps you determine overall efficiency and whether you can achieve tight deadlines or take on additional clients. There are several ways to assess productivity, and determining one that is ideal for your company will take some time and consideration.
15 Productivity Metrics & KPIs to Measure
It might be difficult to navigate the lengthy list of productivity measures and KPIs. Choose the popular productivity measures that will help you grow your business over time.
1) Employee Turnover Rate (ETR)
Employee turnover rate is the proportion of staff members that resign from your company within a specific time frame. Turnover rates are usually calculated quarterly or yearly by organizations. In order to evaluate the success of their hiring practices, they may also decide to compute the turnover rate for recent personnel.
Employee turnover is one of the most important metrics for evaluating the effectiveness of HR departments or HR management systems.
Although a turnover rate of less than 10% is deemed acceptable, a larger rate presents a poor image of the organization and may be a sign of an unmotivated and unproductive staff.
—› Here’s how you can calculate ETR:
Employee Turnover Rate = [R /{(S+L)/2}] X100
Here,
R is the no. of Resignations during a period.
S is the no. of Employees at the start of the period.
L is the no. of employees at the end of the period.
2) Average Handling Time (AHT)
Average handling time (AHT) is a common call centre metric that measures the average amount of time it takes to execute a transaction.
It takes into account: “Talk time“, which is the duration of time that agents converse with clients and “Hold time”, which is the length of time callers are placed on hold by agents.
AHT is a widely used productivity metric in support and customer service organizations. Its four primary goals are as follows:
- Identify high achievers or proactive team members.
- Determine who is underperforming and provide training sessions to help them get better.
- Recognize variations in AHT as indicators of job overload or team stress.
- Make sure you respond quickly to consumers to keep them satisfied.
—› Here’s how you can calculate ATH:
Average Handling Time = (Total talk time + Hold time + Follow-up time) / Total No. of calls
3) Task Completion Rate
The task completion rate calculates the proportion of tasks finished compared to those allotted in a specific amount of time.
This metric for measuring productivity serves as an indicator of operational effectiveness. It assists in identifying gaps in team capability and disturbances to workflows.
If you’re having trouble keeping up with your to-do list, redistributing workloads or looking at more serious problems like imprecise job prioritization, ineffective staff utilization, work overload, or inadequate resources are necessary.
—› Here’s how to calculate the task completion rate:
Task Completion Rate = (No. of completed tasks) / (Total no. of tasks) x 100
4) Revenue Per Sales Rep
This productivity metric determines the income generated by each individual on the sales team.
Teams in sales are inherently competitive. As a result, using sales productivity measures might encourage constructive competition within your team.
However, set aggressive but reasonable sales objectives to inspire your team to go above and beyond to produce revenue.
You are in a better position to make an unbiased assessment if you compare each sales representative’s performance according to metrics like seniority and goals fulfilled.
—› Here’s a quick formula to calculate this metric:
Revenue Per Sales Rep = Total sales / No. of sales made by the sales rep
5) Customer Satisfaction (CSAT)
CSAT measures how satisfied customers are with your product or service. It’s typically obtained through post-interaction surveys where customers rate their experience.
Higher satisfaction rates correlate with higher retention and repeat business. By tracking CSAT, businesses can identify areas where service or product offerings may need improvement and boost overall customer experience.
—›How to Calculate:
CSAT Score (%) = (Number of Satisfied Customers / Total Number of Survey Responses) x 100
6) Overtime Hours
Overtime hours are the extra hours that an employee works outside of their regular planned working hours.
Extended extra hours are indicative of an unfavourable work environment, ineffective team leadership, and uneven job allocation. It just takes one of these elements to lower total staff productivity.
Monitor this indicator to determine hiring requirements and resource shortfalls. For instance, more overtime in your marketing division might mean you need to hire more people there.
In the same way, you may use this statistic to monitor worker productivity and assign tasks according to worker capacity.
—› Here’s a quick formula to calculate this metric:
Overtime Hours = (Overtime Hours) / (Regular Hours) x 100
7) Billable vs. Non-billable Hours
This metric measures the proportion of time employees spend on billable tasks (those that generate revenue) versus non-billable tasks (internal work like meetings, admin, etc.).
A higher proportion of billable hours directly contributes to revenue generation, while non-billable hours can point to inefficiencies. Tracking this ratio allows service-based businesses to ensure that employees are spending the majority of their time on revenue-generating activities.
—› How to Calculate:
Billable Hours Ratio = Billable Hours / Total Hours Worked
8) Sales Growth
Your sales team’s capacity to boost monthly, quarterly, or yearly sales performance is measured by sales growth.
This metric provides information on your business’s revenue growth rate. To obtain micro-level data, consider including filters for one month. This might provide insight into the performance of particular sales agents over longer periods.
This metric will determine which sales funnels result in the greatest conversion rates.
—› How to Calculate:
Sales growth = [(Current net sales – Prior sales period net sales) / Prior sales period net sales] x 100
9) Employee Engagement
Employee engagement refers to how invested employees are in their work and how motivated they are to contribute to the company’s success. It’s often measured via surveys and feedback tools.
Engaged employees are more productive, creative, and less likely to leave. By tracking engagement, businesses can assess the effectiveness of management practices, identify areas of dissatisfaction, and take action to improve workplace culture and overall productivity.
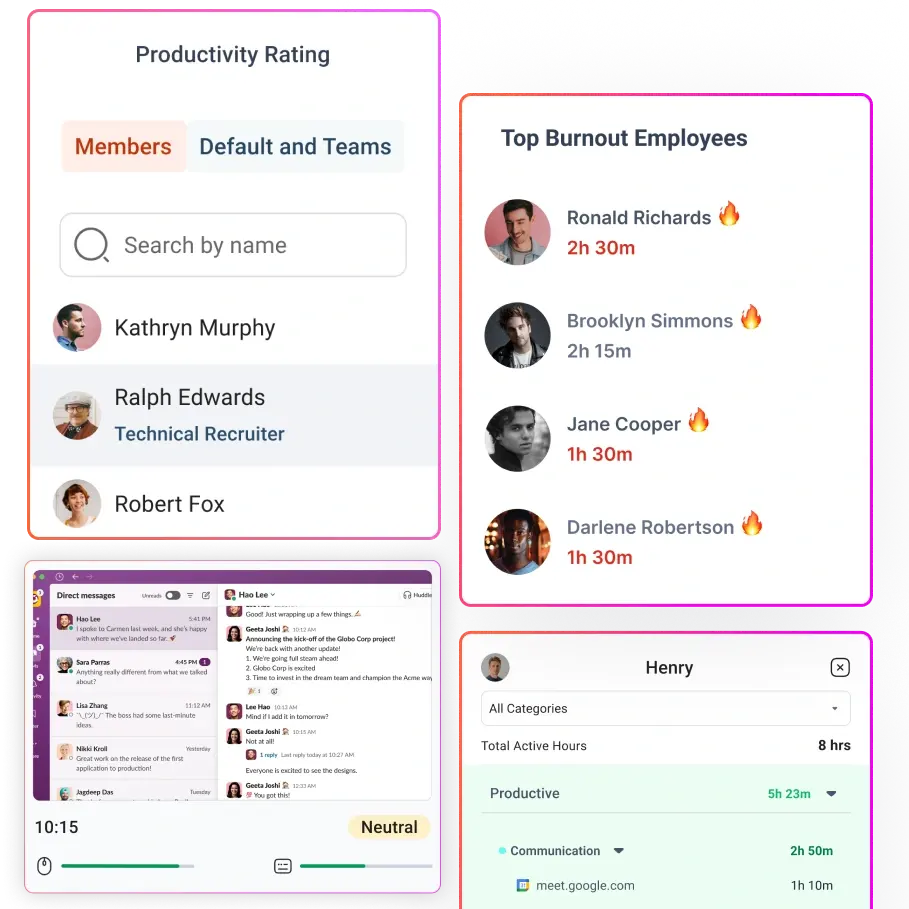
Tracking employee engagement is crucial for improving team morale and productivity. With Flowace, organizations can analyze employee productivity patterns and engagement levels over time, enabling managers to identify areas that need attention.
—› Here’s a quick formula to calculate this metric:
Employee Engagement = Average Engagement Score from Surveys (scaled)
10) Goal Conversion Rate
The goal conversion rate is the proportion of your targeted project’s goals that are accomplished on time.
Increased target conversion rates show how well your project planning techniques and tools are working. Lower rates, on the other hand, indicate scope creep and irrational project deadlines.
Remember that these objectives differ greatly from one another and that the “Task Completion Rate” and this measure are completely unrelated. However, your team’s work ethic is determined by how well they accomplish these predetermined objectives.
—› This is a straightforward formula to calculate the goal conversion rate:
Goal Conversion Rate = (No. of goals met on schedule) / (Total no. of goals) x 100
11) Cycle Time
Cycle time tracks how long it takes to complete a specific task, process, or project, from initiation to completion. It’s used across industries but is especially vital in manufacturing and software development.
Shorter cycle times mean faster project completion and more opportunities to take on additional work. By reducing bottlenecks and improving processes, businesses can increase throughput and maintain high productivity levels.
—› How to Calculate:
Cycle Time = End Date – Start Date
12) Lead-to-MQL Ratio
Marketing qualified leads (MQL) are prospects that have been screened by the marketing team to validate their interest in a certain product or service. The sales team is then tasked with guiding these prospects through the purchase process.
Begin by gathering leads using paid ads, landing pages on websites, email marketing, and social media profiles. To improve lead tracking and qualification, you can connect Salesforce to Google Ads, ensuring a seamless flow of data between marketing and sales teams. Leads become qualified leads (MQLs) whenever your marketing team matches their personalities to your target market.
Your lead-generating departments should be encouraged to use higher MQL rates!
—› Calculate the Lead-to-MQL Ratio with this simple formula:
Lead to MQL Ratio = (No of MQLs) / (Total no. of leads generated) x 100
To effectively implement these metrics, utilizing the right tools can streamline the monitoring and reporting process.
13) Employee utilization
Employee utilization measures the percentage of an employee’s working hours that are dedicated to billable tasks. This metric is crucial in professional services such as consulting, accounting, and project management, as it helps assess how effectively employee time is being utilized.
Formula:
Utilization Rate = (Billable Hours / Eligible Working Hours) × 100
Utilization can differ across various roles and projects since not all working hours are allocated to billable tasks. Employees frequently engage in important non-billable activities, including administrative duties, emails, billing, and meetings, which are essential for supporting their primary responsibilities.
Monitoring employee utilization offers valuable insights that can guide hiring and resource distribution. For instance, high utilization rates may signal a need for more staff to avoid employee burnout, while low rates might indicate that employees are not being fully utilized.
By analyzing this data, organizations can ensure that employees are focused on tasks that align with their roles, ultimately contributing to the company’s revenue and productivity objectives.
14) Employee Efficiency ratings
Performance ratings are essential tools for HR teams, offering clear insights into each employee’s effectiveness and contributions. When making decisions related to human capital management, having a quick overview of employee performance streamlines data collection and facilitates more informed choices.
Efficiency Score Formula:
Efficiency Score = (Total Work Hours – Non-Productive Hours) / Total Scheduled Hours × 100
This formula indicates the percentage of an employee’s scheduled hours spent on productive work, providing a quick overview of efficiency.
Performance ratings are crucial metrics in various areas, from determining individual compensation to shaping organization-wide talent strategies. Here are five ways performance ratings enhance talent management and optimize workforce planning.
Example: Productivity Ratio Calculation
The productivity ratio specifically assesses output about goals. For example:
Productivity Ratio = Orders Completed / Target Orders × 100
If an employee fulfils 30 orders out of a target of 40, their productivity ratio is:
30 ÷ 40 = 75%
These metrics help HR teams align talent management initiatives with business objectives, ensuring that each employee’s role and performance contribute to the overall success of the organization.
15) Workforce cost
Workforce cost, or total cost of workforce (TCOW), refers to the overall expenditure a company incurs for its employees. This encompasses all personnel-related expenses, including:
- Compensation and benefits
- Recruiting and training
- Taxes
- Insurance
- Monthly events
- Vacation pay
- Overtime
- Holiday pay
A typical estimate for the total cost of an employee ranges from 1.25 to 1.4 times their base salary. This estimate accounts for additional costs such as benefits, payroll taxes, and recruitment expenses.
Grasping TCOW enables management to comprehend the complete financial implications of their workforce and how various changes may affect the business.
Some approaches to lowering workforce costs include:
- Leveraging technology to enhance efficiency
- Finding the right balance between outsourcing and in-house capabilities
- Adjusting cost-reduction strategies in response to evolving market conditions.
Does Every Business Need Productivity Metrics?
Not every business needs productivity metrics in the same way, but every business can benefit from them — often more than leaders realize.
Think of productivity metrics as a mirror for your operations. Without them, you might be moving quickly but not necessarily in the right direction. With them, you can see where time, effort, and resources are actually going — and whether they’re producing the results you expect.
For startups and small businesses, these metrics help prioritize limited resources and make sure every hour spent contributes to growth. For mid-sized companies, they bring visibility into team performance, highlight bottlenecks, and support fair workload distribution. And for large organizations, they provide the data needed to optimize processes across multiple teams, departments, or even regions.
That said, the type of productivity metrics you track should match your business stage and goals. A five-person design studio probably doesn’t need the same depth of reporting as a multinational manufacturing company. The key is to focus on metrics that are both measurable and actionable — numbers you can actually use to make better decisions.
In short, while businesses can survive without productivity metrics, they risk running on assumptions instead of facts. And in today’s competitive environment, flying blind is rarely a good strategy. Metrics don’t just tell you how you’re doing — they guide you toward doing it better.
Monitoring and Reporting on Productivity With Software

To effectively monitor these metrics, businesses can use a variety of software tools designed for tracking and reporting productivity.
Tools like Trello for project management, Asana for task tracking, and Flowace for Employee Productivity Tracking offer powerful features to automate reporting and generate insights. Automation in reporting helps businesses maintain real-time visibility into their teams’ performance and quickly identify areas for improvement.
FAQs: Productivity Metrics and KPIs
Q. What is the employee productivity metric?
Employee productivity metrics are measurable indicators of how successfully employees perform and contribute to the company’s objectives. Employers might utilize them to assist in making decisions that are advantageous to the company and the workforce.
Q. What is the KPI for staff productivity?
A key performance indicator (KPI) for staff productivity is a statistic that assesses how well individuals perform and how effectively an organization achieves its goals. KPIs may direct staff members toward success and assist in identifying areas for development.
Q. What are the four types of productivity measures?
The four key types of productivity measures are capital productivity, material productivity, labour productivity, and total factor productivity.
Q. What is the scale to measure employee productivity?
Employee productivity scales comprise job time, job quality, and job quantity aspects, which were confirmed using factor analysis in the created Employee Job Performance (EJP) scale questionnaire.
What is a Productivity KPI?
It shows you whether you’re headed in the right direction and how far you’ve come toward your goal. In a workplace setting, it’s a specific metric—one you can track and measure, that tells you how effectively an employee is working.
But here’s the key thing: it’s not just about how much someone is doing. A good productivity KPI reflects whether the right things are getting done, in the right way, and on time. For instance, someone might send 100 emails in a day, but if none of them lead to results, are they really being productive?
These KPIs differ from role to role:
- In sales, it could be the number of deals closed or revenue generated.
- In customer support, it might be average response time or satisfaction score.
- In operations, it could be tasks completed on time or the error rate.
KPIs help teams move from vague feedback like “do better” to something grounded and specific like “close 10 qualified leads per quarter.” It brings clarity, direction, and focus—not pressure.
What is the Scale to Measure Employee Productivity?
This is a question many managers stumble on, especially because productivity feels like such a subjective thing. But the truth is, with the right scale, you can make it more tangible and fair.
Some companies use numerical rating scales—say, from 1 to 5—where 1 might mean “rarely meets expectations” and 5 means “consistently exceeds expectations.” Others might prefer more structured frameworks like:
- Output volume: How much work is being done? (e.g., number of calls made, lines of code written)
- Quality of work: How accurate or effective is the output? (e.g., error-free reports, client feedback)
- Time efficiency: How well is the employee managing deadlines?
- Consistency: Are they performing steadily or in unpredictable spurts?
And there’s also a more modern trend: self-assessment scales, where employees reflect on their own productivity using journaling tools or dashboards. This builds trust, autonomy, and accountability.
Ultimately, the best scale is one that’s relevant to the role, understood by the employee, and adaptable over time. It’s not about surveillance—it’s about alignment.
How Do You Assess Employee Productivity?
Assessing productivity isn’t just about numbers. It’s about patterns, context, and behaviors. Think of it as a combination of science and storytelling.
Yes, you’ll want to look at clear outputs—how many tasks were completed, how fast, and with what level of quality. But then go a level deeper:
Is the employee spending time on high-value tasks? Are they able to prioritize and focus, or are they constantly reacting? Are they collaborating effectively or working in silos? Do they complete work independently, or require frequent intervention?
The best assessments also involve direct conversations. One-on-ones are goldmines for context: maybe someone’s productivity has dropped because they’re overwhelmed, unclear about their role, or not feeling motivated. Or maybe their productivity has increased because they finally found their rhythm or received the right tools.
You can also use project reviews, pulse surveys, and even peer feedback to round out your view. Just remember, productivity should be a two-way discussion, not a judgment.
What are measurable KPIs for employees?
The power of measurable KPIs lies in their clarity. They remove ambiguity and guesswork. Employees know what success looks like, and managers know what to support.
Let’s look at real examples for different roles:
For a sales executive:
- Number of outbound calls or emails sent weekly
- Number of leads converted into opportunities
- Revenue closed per quarter
For a marketing associate:
- Number of campaigns launched per month
- Lead generation rate per campaign
- Engagement metrics: likes, shares, click-throughs
For a software developer:
- Number of pull requests merged
- Bugs resolved within a sprint
- Deployment cycle time
For a HR recruiter:
- Time to fill open positions
- Number of candidates interviewed vs. offers made
- Offer acceptance rate
For a customer support agent:
- Tickets resolved per day/week
- First response time
- CSAT (Customer Satisfaction Score)
Each of these KPIs is concrete, trackable, and tied to something that matters to the business. But here’s the catch: don’t just measure for the sake of measuring. Choose KPIs that reflect what actually moves the needle in that role.
And always pair KPIs with context and coaching. Numbers alone don’t tell the whole story, they’re just the start of a more informed conversation.
Conclusion:

Measuring productivity is key to staying competitive and optimizing operations. By tracking the right metrics and KPIs, businesses can make smarter decisions, improve employee performance, and achieve better outcomes.
Start by choosing the metrics that align with your goals and use them to guide your team toward continuous improvement.
Ultimately, measuring productivity is essential for maintaining a competitive edge. Incorporating advanced tools like Flowace into your productivity measurement strategy can lead to more informed decision-making and significant improvements in team performance.


