What gets measured gets managed, and what gets managed gets improved.
That’s the basic rule for performance improvement.
Most businesses, like yours, already measure employee productivity in some way. But many aren’t measuring the right efficiency metric. The key is finding a way to link employee output directly to revenue. And this is exactly what the Labor Efficiency Ratio does.
Key Takeaways:
-
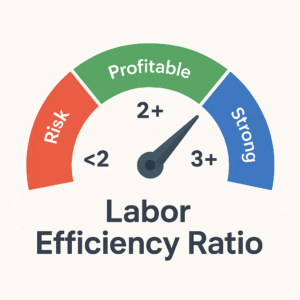
Why LER matters: Labor Efficiency Ratio (LER) links labor costs directly to profitability. An LER above 2.0 usually signals healthy margins, while anything below 2.0 indicates risks to sustainability.
-
How to calculate it: LER = Gross Profit ÷ Total Labor Cost. You can refine it into Direct LER (dLER) for frontline teams and Management LER (mLER) for overhead costs to get sharper insights.
-
Industry benchmarks: Service and consulting businesses thrive at ~2.0, SaaS can reach 2.5+, and retail needs higher ratios (~2.5) to stay profitable. Tracking LER by industry context avoids false alarms.
-
How LER analysis helps: It makes labor spending transparent, guides smarter hiring/pay decisions, highlights productivity bottlenecks, and acts as an early-warning system for profitability risks.
-
Steps to improve: Upskill teams, track time with precision, simplify workflows, adopt automation, and reallocate roles based on performance data. Even small adjustments here can raise efficiency by 20–30%.
-
How Flowace helps: Flowace boosts LER through hands-free time tracking, utilization heatmaps, anomaly alerts, and integrations with tools like Jira and Salesforce. Customers have reported up to a 31% increase in team productivity from its insights.
-
Getting started with Flowace: Define KPIs (like dLER, utilization, realization rates), onboard teams, enable automation and integrations, then review insights weekly. A structured process ensures LER gains compound over time. Start your free trial with Flowace today.
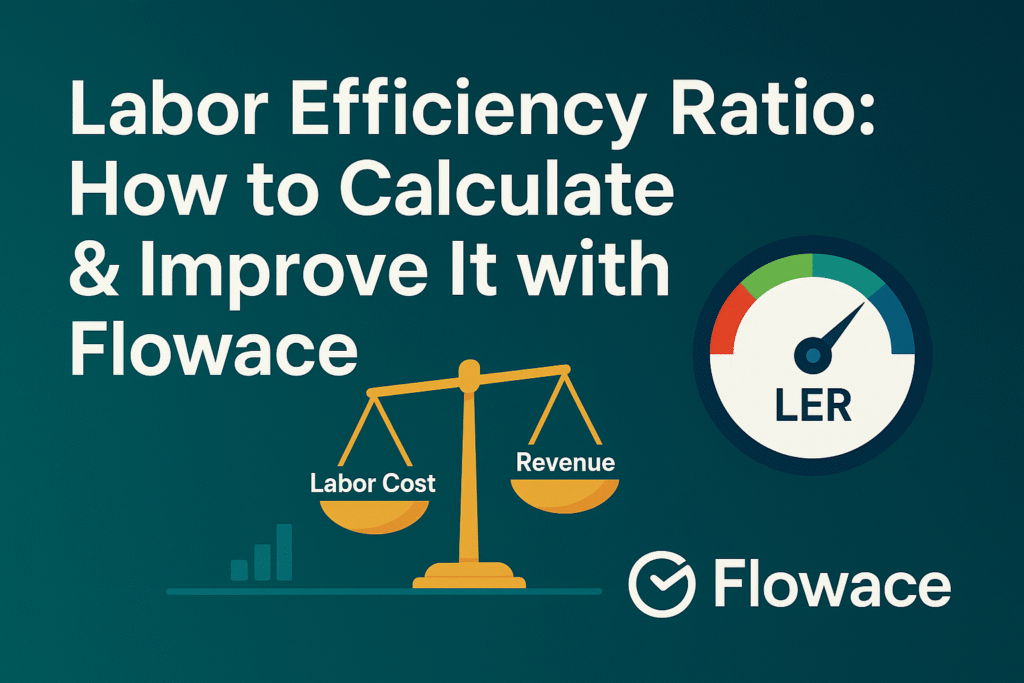
What is the Labor Efficiency Ratio?
The Labor Efficiency Ratio is an efficiency metric that links your workforce’s productivity directly to the profit or revenue generated by your team. While traditional productivity metrics tell you how much work is being done, LER answers the big question:
Are the hours your team puts in actually making money for your business?
Greg Crabtree, author of Simple Numbers, Straight Talk, Big Profits, notes that 90% of businesses consistently meet their profit goals when they maintain an LER of about 2.0, meaning they gain $2 in gross margin for every $1 in labor cost.
Suppose your product team ships features that increase expansion MRR by $50,000 this quarter. After subtracting cloud and support costs, the gross profit comes to $35,000. If payroll for product and engineering is $15,000:
LER = 35,000/15,000 = 2.33, which is healthy.
That said, extremely high ratios aren’t always better. If profitability comes at the cost of employee burnout or underinvestment, long-term performance will suffer.
Three Things to Define Before Calculating Labor Efficiency Ratio
Before you start crunching numbers, make sure you’re working with the right data. LER is only as good as the numbers you feed it. Here are three essentials you need to clarify first:
- What counts as labor?
-
-
- Split roles into direct labor (those creating billable output like developers, consultants, support agents) vs. indirect/management labor (managers, HR, finance, admin, sales).
- This distinction lets you measure dLER vs. mLER (more on this in the next section) separately, instead of hiding inefficiencies by lumping everyone together.
-
- What does “value” mean for your business?
-
-
- Choose the right output metric for the numerator in LER:
- Revenue (simple, broad view).
- Gross Profit (preferred for accuracy; Crabtree’s method).
- Contribution Margin (useful for management LER).
- Units of Output (non-monetary, e.g. calls resolved, units produced).
- Pick one metric and stick to it consistently.
- Choose the right output metric for the numerator in LER:
-
- What is your measurement period?
-
- Decide the time frame: monthly, quarterly, yearly, or project-based.
- Most businesses use monthly LER for spotting trends and quarterly averages to detect anomalies.
- You need to track LER regularly to react quickly to changes.
How Can You Calculate The Labor Efficiency Ratio For Your Team?
The basic Labor efficiency formula is:
Labor Efficiency Ratio (LER) = Gross Profit / Total Labor Cost
(You can use any chosen metric instead of gross profit for LER calculation)
Steps to Calculate LER:
- Find your “value” (output):
- Usually Gross Profit = Revenue – Cost of Goods Sold (COGS).
- Example: $600k revenue – $400k COGS = $200k gross profit.
- Add up labor costs:
- Include wages, salaries, and benefits for all employees counted as “labor.”
- Example: $100k total payroll (or split direct vs. management if needed).
- Compute LER:
- Formula: Value ÷ Labor Cost.
- Example: $200k ÷ $100k = 2.0.
- Interpret the result:
- 2.0 = $2 in gross profit per $1 in labor (a healthy benchmark).
- 1.5 = low efficiency, risky for covering overhead.
- 3.0 = very strong efficiency and profitability.
For more nuanced insight, you can extend this into two sub-ratios:
Direct Labor Efficiency Ratio
Direct LER (dLER) = Gross Profit ÷ Direct Labor Cost.
This shows how efficient your main, revenue-earning team is.
For example: If your company makes $600k in revenue and has $350k in non-labor costs. That leaves $250k gross profit. Out of $120k total labor cost, $80k goes to direct workers.
So, dLER = 250k ÷ 80k ≈ 3.13.
This means every $1 spent on your core team produced about $3.13 of profit. A dLER above 2.5 is usually excellent.
Management Labor Efficiency Ratio
Management LER (mLER) = Contribution Margin ÷ Management Labor Cost.
Contribution margin = Gross Profit – Direct Labor Cost.
Example: From $250k gross profit, subtract $80k direct labor = $170k contribution margin. If management salaries were $40k, then:
mLER = 170k ÷ 40k ≈ 4.25.
So, for every $1 spent on managers, $4.25 of profit remained. If this ratio drops too low (below ~1–2), it means overhead costs are eating into your profitability.
Confused? Don’t overthink it.
Here’s the gist:
- If dLER is low, it means your frontline team isn’t generating enough value. Maybe because productivity is low or prices are too tight.
- If mLER is low, it means overhead costs are too heavy, or your support staff isn’t helping the business create enough profit.
Benchmarks for LER in Different Industries
- Service Businesses (agencies, consulting, IT): LER around 1.5–2.5 is common. Because labor is the main cost, hitting 2.0 often means healthy margins (15–20%). Some firms even check LER per project/client.
- Manufacturing & Construction: LER of ~2.0 is solid, but some companies run a bit lower and make up for it with higher volume. Falling LER signals shop floor/job site productivity issues.
- Retail & Distribution: Need a higher LER (~2.5) because product margins are thin. At 2.0, many retailers would only break even.
- Staffing Firms: LER looks different since they “resell labor.” The key is that recruiters (internal staff) must place enough candidates to cover their cost.
- Tech & SaaS: These often have high margins and can show very strong dLER when sales are good. But during heavy hiring or growth phases, LER can dip. Long-term, SaaS firms still need LER above 2.0 for profitability.
Labor Efficiency Ratio vs. Labor Productivity: What’s the Difference?
Is LER just another way to talk about labor productivity? Not exactly. But they are related.
| Aspect | Labor Productivity | Labor Efficiency Ratio (LER) |
| Definition | Output per unit of labor (e.g., units/hour, revenue per employee) | Profit or value per $1 spent on labor |
| Focus | Volume, efficiency, and effectiveness of work | Profitability and financial return on labor |
| Measurement Examples | Units produced per hour, revenue per employee, GDP per worker | Gross profit ÷ labor cost |
| Question Answered | “How much work gets done with our labor?” | “Is the work we’re paying for actually profitable?” |
| Example | Worker makes 10 gadgets/hour vs. 8 last year → productivity up | If labor costs rise or products are heavily discounted → LER down, even if output rises |
| When It Improves | More output per hour, better processes, higher skills | Higher margins, stable/low labor cost, efficient pricing |
| When It Declines | Less output per worker, inefficiencies, poor training | Rising labor costs, lower pricing, weak margins |
| Key Use | Identifies process efficiency | Identifies financial efficiency |
Why the Labor Efficiency Ratio Matters for Your Business
Labor Efficiency Ratio has very real implications for your company’s health and strategy. Here are a few key reasons why LER matters:
- Shows profitability quickly: If your LER is above 2, you’re usually profitable. If it drops below 2, you’re likely losing money.
- Gives early warnings: Tracking LER monthly (or weekly) helps you spot problems like overtime costs or project overruns before they eat away profits.
- Guides smart decisions: You can see which teams, projects, or even clients give the best return on labor, and shift resources accordingly.
- Measures performance fairly: LER ties team performance directly to financial results, helping decide if hires, raises, or training are really paying off.
- Supports hiring & pay decisions: A high LER means you can safely invest in more people or raises; a low LER suggests holding back until efficiency improves.
What are the Common Barriers to a High Labor Efficiency Ratio?
The Labor Efficiency Ratio connects your biggest expense(people) to your biggest goal(profit). Below are some of the most common barriers that prevent businesses from achieving a high LER:
Untracked or wasted time
When time is not measured properly, inefficiencies go unnoticed. Hours disappear in overtime, meetings, distractions, or poor tracking. Without visibility, teams may work on the wrong tasks and efficiency suffers.
Poor task prioritization
Not all work adds equal value. If employees spend too much time on low-impact activities, labor costs rise without strong returns. For instance, sales staff doing data entry or developers stuck in meetings contribute less to growth. Clear priorities are essential for maintaining a healthy LER.
Inefficient workflows and outdated processes
Slow or outdated processes reduce productivity even for motivated teams. Manual data entry, extra approvals, or old tools mean more hours for the same output, raising costs and lowering LER. Inefficient workflows also create frustration and burnout.
Low employee engagement or skill gaps
Motivation and skills directly affect output. Disengaged employees add little value, while untrained staff take longer or make mistakes. Without proper training, recognition, and growth opportunities, efficiency and LER both decline.
Async & meeting bloat
Excess context switching and status meetings inflate non-value hours; even with high utilization, LER falls if time isn’t revenue-creating.
AI under-adoption
Teams skipping AI copilots spend more time on routine work; same payroll, less output = lower LER.
How Does LER Analysis Benefit Your Business Productivity And Growth?
Digging into your labor efficiency ratio gives you insights far beyond a simple cost number. It provides:
- Clear visibility into labor costs vs. returns: LER shows exactly how much return you get for every labor dollar, making payroll spending transparent and tying costs directly to growth.
- Deeper productivity insights: LER highlights which teams generate value and which just stay busy, helping spot bottlenecks and inefficiencies across the organization.
- Smarter workforce planning and staffing: By tracking LER, leaders can make data-driven hiring decisions—expanding high-performing teams and pausing growth in low-return areas.
- Data-driven performance tracking: LER provides an objective way to measure team efficiency and set performance goals, replacing guesswork with clear, measurable KPIs.
- Better insight from time tracking and tools: Combining LER with time tracking pinpoints wasted hours, duplicate efforts, or low-value work, making it easier to streamline workflows.
- Early warning system for problems: Falling LER signals rising costs, lost productivity, or revenue issues, giving leaders a chance to fix problems before profits are hit.
- More accurate forecasting and growth decisions: LER offers a reliable basis for budgeting and growth planning, letting businesses project profit potential from labor investments with confidence.
5 Smart Steps To Improve Labor Efficiency And Unlock Productivity Insights
Whether your current LER is 1.2 or 2.5, there are always ways to boost efficiency.
Step 1: Invest in Skills & Training
- Upskill employees to work faster, reduce errors, and require less oversight.
- Cross-train to remove bottlenecks and improve overall productivity.
Step 2: Track Time to Identify Productivity Gaps
- Use AI-assisted time analytics to surface idle time, deep-work blocks, meeting load, context switches per role.
- Analyze patterns like long meetings, idle time, or low-value tasks.
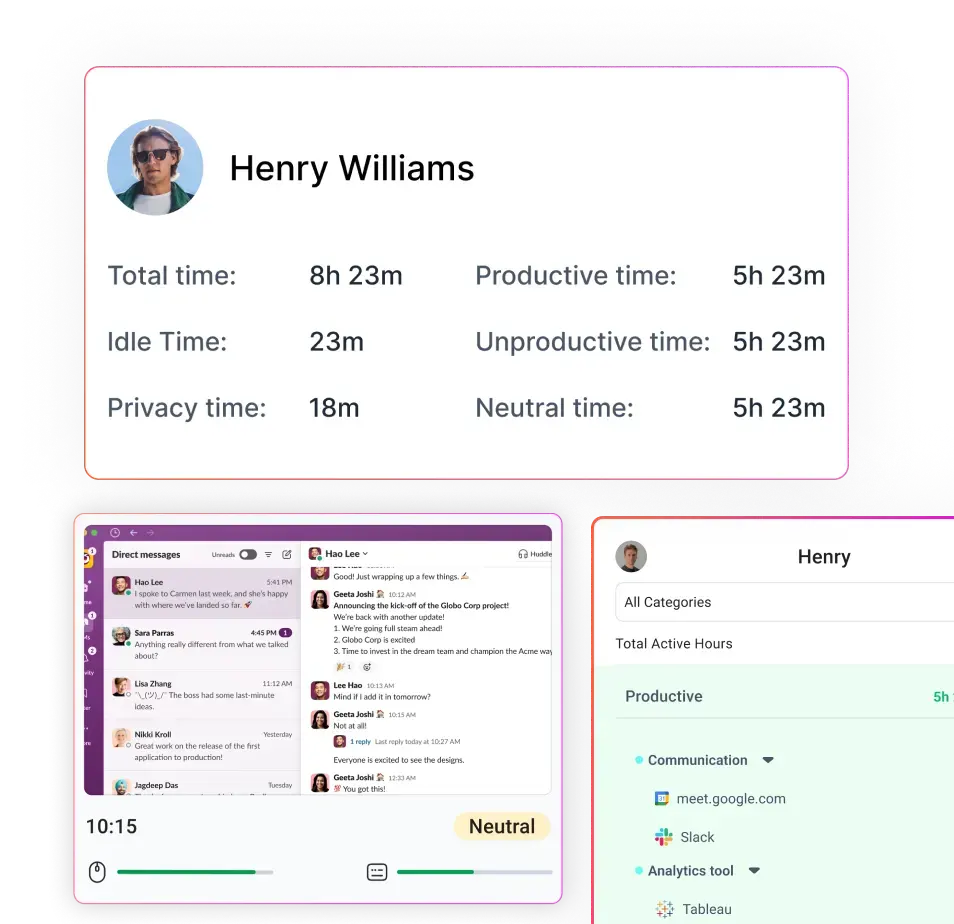
- Tools like Flowace provide real-time insights into productive vs. unproductive hours.
Step 3: Simplify Workflows
- Eliminate unnecessary steps, approvals, and duplicate work.
- Standardize processes and use project management tools (e.g., Kanban boards) to smooth bottlenecks.
- Focus on “working smarter, not harder.”
Step 4: Automate and Integrate
- Enable automatic timesheets and calendar/call capture so zero minutes of billable work are lost. Gravitas Legal saved 37 mins per day using Flowace’s automated timesheet.
- Integrate systems (Jira, Asana, Salesforce, payroll, etc.) to cut duplicate entry and errors.
- Use alerts and AI for early productivity intervention.
Step 5: Realign Roles Based on Data
- Assign tasks to employees where they add the most value.
- Reallocate resources if some teams are overloaded or underutilized.
- Continuously optimize roles to match performance and demand.
Following these steps creates a cycle of continuous improvement.Even small changes like adopting automatic time tracking and timesheet automation can lead to significant productivity gains. Flowace users, for example, have seen up to a 31% increase in team productivity just from better tracking and insights.
How can Flowace help you improve your Labor Efficiency Ratio?
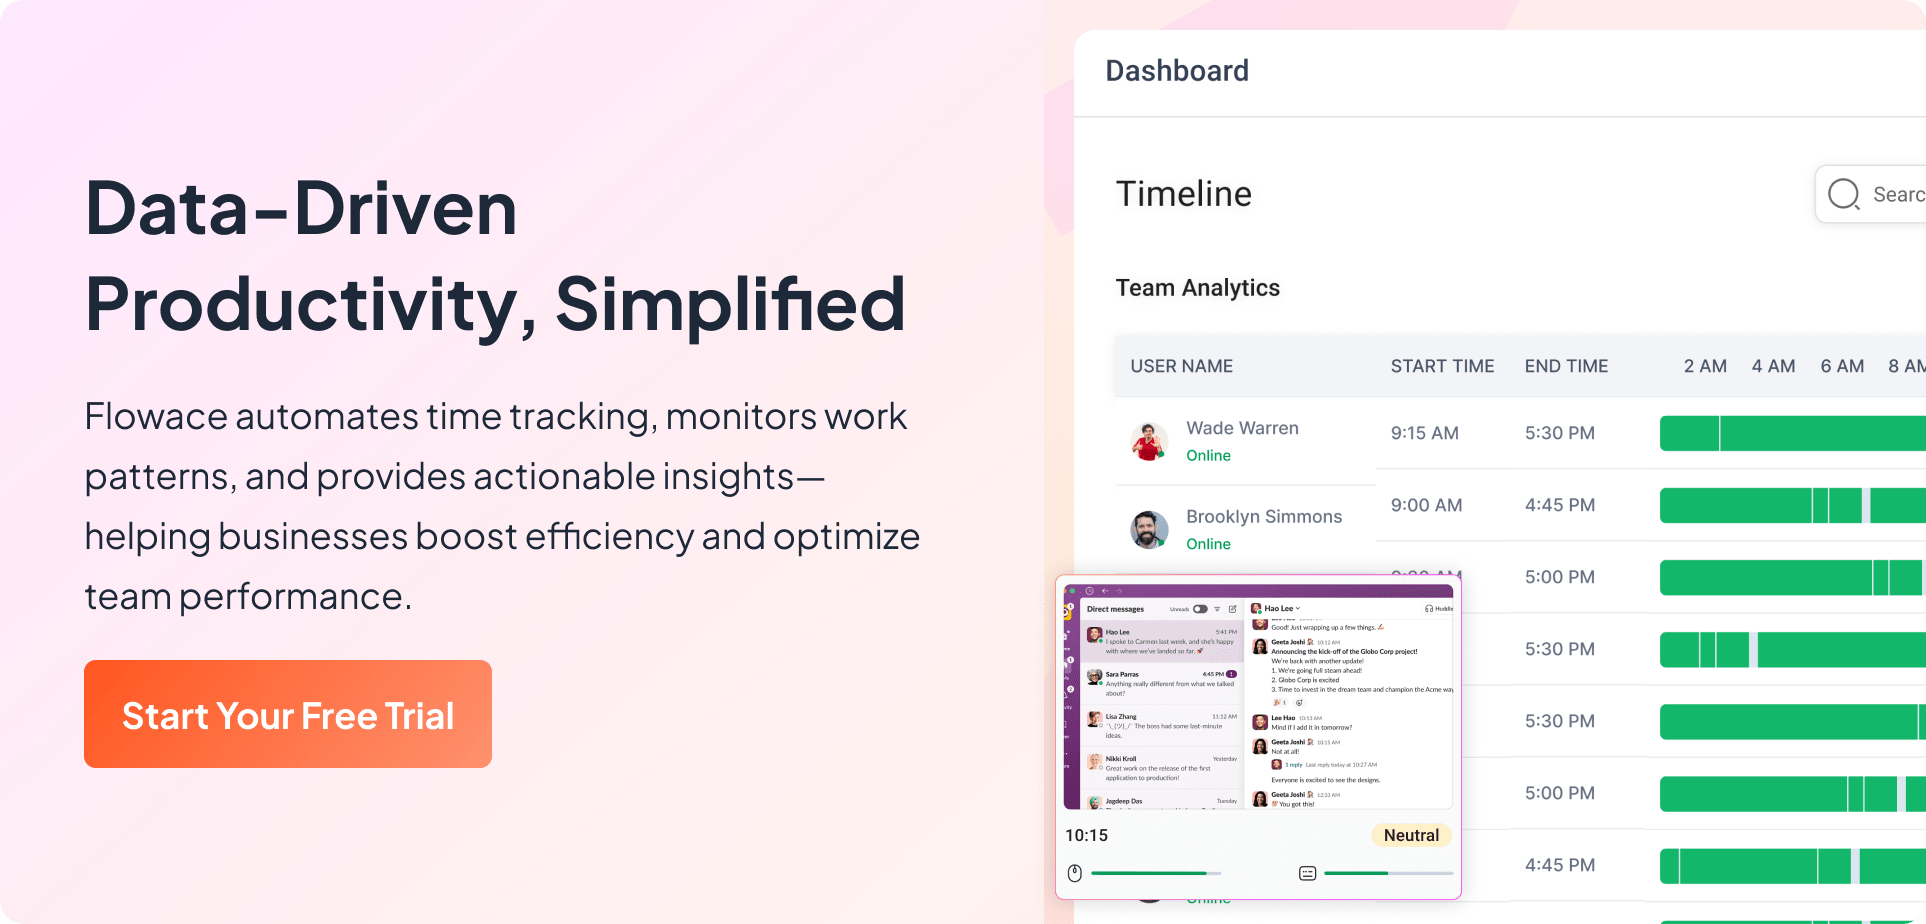
As an all-in-one employee monitoring software, Flowace combines automatic time tracking, real-time analytics, and smart automation to ensure every labor hour delivers maximum value. It works quietly in the background 24/7, logging your billable hours and giving you insights to stay ahead. . That means no more manual timesheets and up to 90% of that admin time can be spent on meaningful work.
But Flowace does more than just track. It offers:
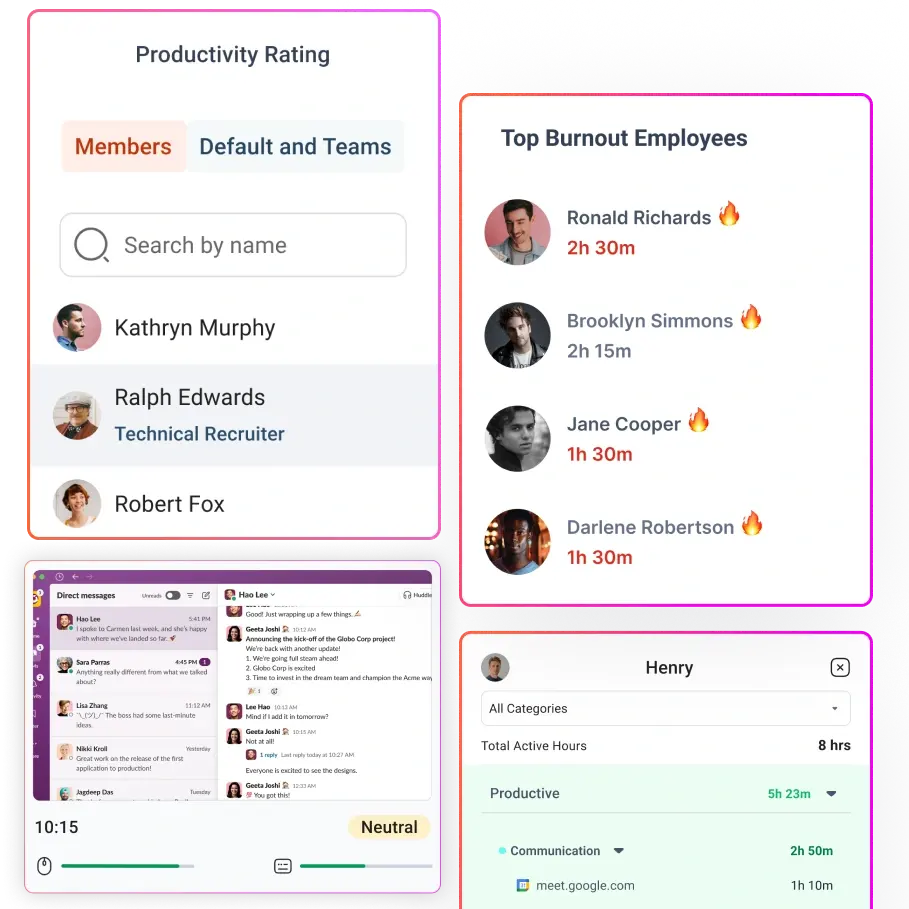
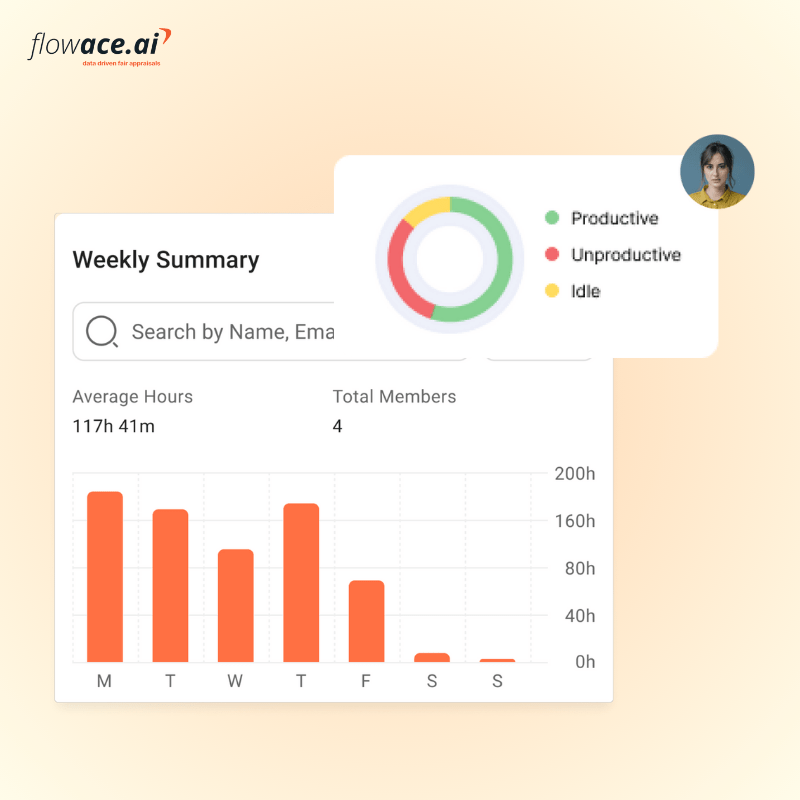
Real-time insights: You get a live dashboards that offers actionable insights. It shows what slows your team down, and where workloads are uneven. You can also spot bottlenecks early and prevent employee burnout.
AI anomaly & over-budget alerts: Get notified when hours grow faster than value. If hours go up but tasks or billing stay the same, you’ll know right away before efficiency drops.
Utilization heatmaps: Spot under/over-used roles by day and hour; rebalance to keep dLER high without over-hiring.
Automatic calendar & call capture: Meetings and client calls are auto-logged so billable time isn’t lost
Smart alerts: Flowace keeps everyone focused with smart alerts and reminders. Its scheduling and attendance tools help you line up labor with business needs.
Integrations: Flowace connects with tools like Jira, Asana, Salesforce, and payroll systems, you don’t waste time doing the same work twice.
How can you boost your LER with Flowace: 4 Steps to Get Started
Getting started with Flowace is easy. To get the best performance and improve your LER, you need to follow a few proven steps.
- Set Clear Goals and KPIs
The first step to improving your Labor Efficiency Ratio (LER) with Flowace is setting clear and measurable goals. Define exactly what success looks like. For instance, you may want to raise your LER from 1.8 to 2.2 within six months.
When setting up your plan, identify the right Key Performance Indicators (KPIs) to monitor. These could include:
- Deep-work hours/engineer/week (SaaS)
- Realization rate & write-off % (Consulting)
- Context-switches/hour (all roles)
- Onboard and Track Time
Roll out Flowace across teams and train employees on its hands-free tracking. Allow a short adjustment period to capture accurate baseline data. Make sure tasks are categorized correctly so insights reflect real work.
- Use Automation and Integrations
After onboarding, start leveraging Flowace’s automation features to save time and eliminate repetitive tasks. For example:
- Automate timesheets, reminders, and weekly reports.
- Integrate Flowace with payroll and project management systems.
- Customize alerts such as notifications for projects going over budgeted hours or weekly LER summaries.
By letting Flowace handle these administrative tasks, managers can focus their efforts on analyzing data, solving workflow issues, and driving efficiency improvements.
- Review Insights and Adjust
With Flowace fully in place, commit to a consistent review process. Regularly monitor the dashboards and reports to identify patterns and improvement opportunities.
Key actions at this stage include:
- Reassigning resources or adjusting processes based on data.
- Continuously refining LER goals as milestones are achieved.
- Run a Friday 20-minute LER huddle: top 3 wins, top 3 drags (meetings, idle, scope), one change for next week.
Over time, this feedback loop ensures that productivity improvements are sustained and continuously built upon.
Final Thoughts
Labor efficiency ratio (LER) is more than just a number. It shows how well your team’s time translates into real results. A high LER means your people are focused, efficient, and fueling growth. A low LER signals wasted effort, broken processes, and lost opportunities. The good news is that you can improve it.
With Flowace, you get automatic tracking, real-time insights, and smart automation that lift productivity by 20 to 30 percent.
Take control of your labor efficiency ratio with Flowace. Start your free trial today.