21 KPIs in BPO Call Centre With Formulas and Benchmarks




BPO call centre KPIs are measurable metrics that show how well agents and teams meet performance goals, including service quality, speed, and cost targets.
This article covers 21 KPIs in BPO call centre with formulas and benchmarks, plus KPIs by role, KPI vs KRA differences, and simple ways to track performance. Use the table below to find the metrics your team measures most.
Formula and Benchmark Table for KPIs in BPO Call Centre
All 21 KPIs at a glance. Each one is explained below in the same order.
|
KPI |
Formula | Benchmark |
Category |
| Customer Satisfaction Score (CSAT) | (Satisfied responses ÷ Total responses) × 100 | Good is 75-84%, world class is 85%+ | Customer experience |
| Net Promoter Score (NPS) | % Promoters − % Detractors | 30+ is strong for service teams | Customer experience |
| Customer Effort Score (CES) | Sum of effort ratings ÷ Total responses | Higher ease scores predict loyalty | Customer experience |
| First Call Resolution (FCR) | (Issues resolved on first call ÷ Total calls) × 100 | Average 70%, world class 80%+ | Customer experience |
| Quality Assurance (QA) Score | (Points scored ÷ Total audit points) × 100 | Most teams target 85%+ | Customer experience |
| Average Handle Time (AHT) | (Talk + Hold + After-call work) ÷ Calls handled | Varies by call type, track your trend | Operational |
| Service Level | (Calls answered within target ÷ Total calls) × 100 | 80/20 is the common standard | Operational |
| Average Speed of Answer (ASA) | Total answer wait time ÷ Calls answered | Tied to your service level target | Operational |
| Call Abandonment Rate | (Abandoned calls ÷ Total inbound calls) × 100 | Keep under 5% | Operational |
| Occupancy Rate | (Handling time ÷ Available time) × 100 | Healthy band is 75-85% | Operational |
| After-Call Work Time (ACW) | Total wrap-up time ÷ Calls handled | Shorter with automation, watch the trend | Operational |
| Agent Utilization Rate | (Handle time ÷ Logged-in time) × 100 | Balance output with burnout risk | Agent performance |
| Schedule Adherence | (Time worked as scheduled ÷ Scheduled time) × 100 | Top teams target 90%+ | Agent performance |
| Agent Attrition Rate | (Agents who left ÷ Average headcount) × 100 | Lower is better, benchmark by market | Agent performance |
| Calls Handled per Hour | Calls handled ÷ Hours worked | Pair with QA score, never alone | Agent performance |
| Escalation Rate | (Escalated calls ÷ Total calls) × 100 | Rising trend signals training gaps | Agent performance |
| Repeat Call Rate | (Repeat calls on same issue ÷ Total calls) × 100 | Mirrors FCR, keep it falling | Agent performance |
| Cost per Call | Total operating cost ÷ Calls handled | Benchmark against your contract rate | Financial and client |
| Revenue per Successful Call | Revenue from converted calls ÷ Converted calls | Outbound and sales programs | Financial and client |
| SLA Compliance Rate | (Intervals meeting SLA ÷ Total intervals) × 100 | Contracts often require 95%+ | Financial and client |
| Billable Hours Utilization | (Billable hours ÷ Logged hours) × 100 | Every point protects margin | Financial and client |
What Is KPIs in BPO Call Centre
A KPI (Key Performance Indicator) in a BPO call centre is a measurable metric that shows how well agents and teams meet client goals.
These goals usually focus on service quality, speed, cost, and revenue. KPIs turn daily call centre activities into clear data that managers and clients can use to improve work performance.
The full form of KPI is Key Performance Indicator.
BPO call centre use KPIs to measure service delivery, meet client expectations, and track contract performance. Many client agreements are tied to specific performance targets, making KPI tracking important for account success.
What Is the Difference Between KPI and KRA in BPO
A KPI is a measurable metric used to track performance. A KRA (Key Result Area) defines the broader responsibility area that the metric supports.
A KRA explains the area an employee or team is responsible for. A KPI measures how effectively that responsibility is being achieved.
|
Basis |
KPI | KRA |
|
Full Form |
Key Performance Indicator |
Key Result Area |
| What it defines | A specific measurable number |
A broad area of responsibility |
|
Example for an agent |
FCR of 75%, CSAT of 85% | Customer issue resolution |
| Example for a team leader |
Team attrition under 20% |
Team performance and retention |
|
Review style |
Tracked daily or weekly |
Set yearly, reviewed in appraisals |
For example, an agent’s KRA may be customer support quality. The KPIs used to measure it can include CSAT, FCR, and QA score. These metrics help managers evaluate performance during appraisals, reviews, and daily operations. Understanding KPI and KRA differences is a common requirement for BPO agents, team leaders, and managers.
Customer Experience KPIs in BPO Call Centre

The five customer experience KPIs in BPO call centre are CSAT, NPS, CES, FCR, and QA score. These metrics help teams measure customer satisfaction, service quality, and how effectively agents resolve customer issues.
1. Customer Satisfaction Score (CSAT)
CSAT measures how satisfied customers are with a call, rated on a short survey right after the call.
Formula: CSAT = (Number of satisfied responses ÷ Total responses) × 100
Benchmark: SQM Group’s study of 500+ North American call centers puts a good CSAT at 75% to 84%. World class is 85% or higher and only 5% of call centres get there.
Fix: Give agents the power to fix common issues without sign-offs. Waiting hurts scores faster than any script issue.
2. Net Promoter Score (NPS)
NPS measures loyalty by asking customers how likely they are to recommend the brand, on a 0 to 10 scale.
Formula: NPS = % Promoters (9-10) − % Detractors (0-6)
Benchmark: A score above 30 is strong for service teams. In a BPO, NPS often feeds directly into client renewal talks.
Fix: Call back detractors within 48 hours. Won-back detractors often become the strongest promoters.
3. Customer Effort Score (CES)
CES measures how easy it was for the customer to get their issue solved.
Formula: CES = Sum of all effort ratings ÷ Total survey responses
Benchmark: Scales differ, so the trend matters more than the raw score. Falling effort scores predict rising loyalty.
Fix: Cut transfers. Every handoff adds effort and drags CES down with it.
4. First Call Resolution (FCR)
FCR measures the share of issues fully resolved on the first call, with no callback needed.
Formula: FCR = (Issues resolved on first contact ÷ Total calls) × 100
Benchmark:
Fix: Route calls by agent skill. Calls sent to the wrong queue are the biggest silent FCR killer.
5. Quality Assurance (QA) Score
QA score rates how well an agent follows the call quality standards on a scorecard, from greeting to compliance to resolution.
Formula: QA score = (Points scored ÷ Total possible audit points) × 100
Benchmark: Most BPO programs target 85% or higher, agreed with the client.
Fix: Run a structured call audit process weekly instead of random spot checks. Steady sampling keeps scores fair and coaching useful.
Operational Efficiency KPIs in BPO Call Centre
The six operational KPIs are AHT, service level, ASA, call abandonment rate, occupancy rate and after-call work time. These show whether the floor is staffed and paced to handle the call load.
6. Average Handle Time (AHT)
AHT is the average time an agent spends per call, including talk time, hold time and after-call work.
Formula: AHT = (Total talk time + Hold time + After-call work) ÷ Calls handled
Benchmark: AHT varies widely by call type and industry. A billing query and an insurance claim will never match. Track your own trend against your baseline.
Fix: Automate wrap-up notes. Less after-call work lowers AHT without rushing the customer.
7. Service Level
Service level is the percentage of calls answered within a set time target.
Formula: Service level = (Calls answered within target ÷ Total calls received) × 100
Benchmark: The 80/20 rule is the most common standard. It means 80% of calls are answered within 20 seconds. Many client contracts write this straight into the SLA.
Fix: Forecast call arrival patterns by half-hour interval. Staffing to the daily average hides the peaks that break your target.
8. Average Speed of Answer (ASA)
ASA is the average time a caller waits before an agent picks up.
Formula: ASA = Total answer wait time ÷ Total calls answered
Benchmark: ASA follows your service level target. If your standard is 80/20, ASA should sit well under 20 seconds.
Fix: Offer callbacks during spikes. A callback beats a long hold on every KPI after it.
9. Call Abandonment Rate
Call abandonment rate is the share of callers who hang up before reaching an agent.
Formula: Abandonment rate = (Abandoned calls ÷ Total inbound calls) × 100
Benchmark: Keep it under 5%. Anything above that needs a staffing or routing review.
Fix: Show queue place and likely wait in the IVR. Callers who know the wait hang up less.
10. Occupancy Rate
Occupancy rate is the share of logged-in time an agent spends handling calls or wrap-up work.
Formula: Occupancy = (Total handling time ÷ Total available time) × 100
Benchmark: The healthy band is 75% to 85%. Above 85% for weeks at a time is a burnout signal.
Fix: Watch occupancy alongside attrition. Long overload shows up in exits two quarters later.
11. After-Call Work Time (ACW)
ACW is the average time an agent spends on notes, tagging and updates after each call ends.
Formula: ACW = Total wrap-up time ÷ Calls handled
Benchmark: There is no universal target. Rising ACW usually points to clunky tools or messy note formats.
Fix: Give agents call note templates. Set fields beat free-text notes for speed and clean data.
Hidden efficiency gaps improved AM2PM’s agent activity from 75.1% to 84%.
Read The Full Case StudyAgent Performance KPIs in BPO Call Centre
The six agent performance KPIs are utilization, schedule adherence, attrition, calls per hour, escalation rate and repeat call rate. Together they show how agent time converts into output, a core part of call center productivity.
12. Agent Utilization Rate
Utilization is the share of total logged-in time an agent spends on call handling work.
Formula: Utilization = (Total handle time ÷ Total logged-in time) × 100
Benchmark: Utilization counts breaks, meetings and training, so it runs lower than occupancy. Read both together before setting targets.
Fix: Cross-train agents across client queues. Idle time on one queue can soak up overflow on another.
13. Schedule Adherence
Schedule adherence is the share of scheduled time an agent actually works as planned.
Formula: Adherence = (Time worked as scheduled ÷ Total scheduled time) × 100
Benchmark: Top teams target 90% or higher. Our full article on schedule adherence in a call center covers targets and fixes in depth.
Fix: Alert team leads in real time when adherence drops. End-of-day reports fix nothing on the day it matters.
14. Agent Attrition Rate
Attrition rate is the share of agents who leave the team in a given period.
Formula: Attrition = (Agents who left ÷ Average headcount) × 100
Benchmark: Attrition shifts by market and program, so compare against your own history and local peers. A falling rate is the goal either way.
Fix: Watch workload balance signals early. Uneven queues and constant overtime predict exits before notice letters do.
15. Calls Handled per Hour
Calls handled per hour is the average number of calls an agent completes in one working hour.
Formula: Calls per hour = Total calls handled ÷ Total hours worked
Benchmark: There is no safe universal number. Read it next to the QA score so speed never wins over quality.
Fix: Share top performer call flows with the team. Speed comes from process, so teach the process.
16. Escalation Rate
Escalation rate is the share of calls passed up to a team lead or a higher tier.
Formula: Escalation rate = (Escalated calls ÷ Total calls handled) × 100
Benchmark: Judge the trend. A rising rate points to training gaps or agents who lack the power to act.
Fix: Log the reason for every escalation. The top three reasons become next month’s training plan.
17. Repeat Call Rate
Repeat call rate is the share of customers who call back about the same issue.
Formula: Repeat call rate = (Repeat calls on same issue ÷ Total calls) × 100
Benchmark: This is the mirror of FCR. If FCR is 70%, roughly 30% of customers are calling back.
Fix: Tag repeat calls by root cause. Fixing one broken process can clear hundreds of repeat calls.
Financial and Client KPIs in BPO Call Centre

The four financial KPIs are cost per call, revenue per successful call, SLA compliance rate and billable hours utilization. These numbers decide margins and renewals. They matter more now that clients want proof of results.
sc name=”fw_stat” link_url=”https://ir.isg-one.com/news-market-information/press-releases/news-details/2024/ISG-Study-Finds-Enterprises-Save-an-Average-of-15-Percent-with-Business-Process-Outsourcing/” stat_desc=”As of 2024, an ISG survey of 368 executives found BPO delivers 15% average cost savings and an 11% quality gain over in-house operations. Only 38% rated their cost savings as very good or excellent.” link_text=”ISG survey of 368 executives” ][/sc]
That gap is why cost per call, SLA compliance and billable hours deserve constant tracking.
18. Cost per Call
Cost per call is the total cost of running the operation divided by the calls handled.
Formula: Cost per call = Total operating cost ÷ Total calls handled
Benchmark: Benchmark against your contracted per-call or per-hour rate. The gap between the two is your margin.
Fix: Move simple, repeat queries to self-service. Every low-value call you deflect lowers the average.
19. Revenue per Successful Call
Revenue per successful call is the average income earned from each converted call in sales or collections programs.
Formula: Revenue per successful call = Total revenue from converted calls ÷ Number of converted calls
Benchmark: Set targets per campaign. Lead quality moves this number more than agent skill does.
Fix: Review the top 10% of converting calls each month. Copy the openings and objection handling that work.
20. SLA Compliance Rate
SLA compliance rate is the share of report windows where the team met the promised service levels.
Formula: SLA compliance = (Intervals meeting SLA ÷ Total intervals) × 100
Benchmark: Many contracts ask for 95% or higher, with penalties below that line. Check your own contract.
Fix: Set alert thresholds just above the SLA line. Acting at 82% on an 80% target is cheap. Acting at 79% is costly.
21. Billable Hours Utilization
Billable hours utilization is the share of logged agent hours you can actually invoice to clients.
Formula: Billable utilization = (Billable hours ÷ Total logged hours) × 100
Benchmark: Every point you recover goes straight to margin. Most leakage hides in untracked aux time and manual timesheets.
Fix: Automate time capture. Manual timesheets undercount billable work and invite disputes.
KPIs by Role in a BPO
 Each BPO role has different KPIs based on its responsibilities. Agents track call-level performance, team leaders track team outcomes, and quality analysts and trainers focus on service quality and employee readiness.
1. KPIs of an Agent in BPO
An agent’s main KPIs include AHT, FCR, CSAT, schedule adherence, and QA score. These metrics measure call handling speed, issue resolution, customer satisfaction, attendance discipline, and service quality.
Agents are often measured closely on FCR and CSAT because they directly impact customer experience and client expectations.
2. KPIs of a Team Leader in BPO
A team leader’s KPIs include service level, shrinkage, team attrition, escalation rate, and average team QA score.
These metrics help measure how well the team performs, how effectively staffing is managed, and how often issues require additional support.
3. KPIs of a Quality Analyst in BPO
A quality analyst’s KPIs include audits completed, calibration variance, scoring accuracy, and feedback turnaround time.
Calibration variance is important because consistent scoring helps maintain accurate quality measurements across the team.
4. KPIs of a Trainer in BPO
A trainer’s KPIs include training completion rate, time from nesting to production, new-hire QA scores, and knowledge check pass rates.
New-hire performance during the first 30 days helps show how effectively training prepares agents for live customer interactions.
How KPIs Work Together
BPO KPIs are connected. Improving one metric can affect another, so teams should track related KPIs together instead of focusing on a single number.
1. Service Level and Abandonment Rate
Long wait times increase the chance of callers leaving before reaching an agent. Better staffing and call routing can improve both service level and abandonment rate.
2. FCR and Repeat Calls
When issues are solved during the first interaction, customers are less likely to call again. Higher FCR usually leads to fewer repeat calls and lower workload.
3. AHT and FCR
Reducing AHT too aggressively can cause agents to rush conversations. This can lower resolution quality and impact FCR.
4. Occupancy and Attrition
Very high occupancy levels over long periods can increase agent stress and burnout. Maintaining a healthy occupancy range helps support retention.
5. Agent Experience and CSAT
Agents with proper support, training, and manageable workloads often deliver better customer experiences. Strong team health can improve CSAT scores.
The key takeaway: Track KPI groups together. Coaching teams on connected metrics gives a more accurate view of performance.
How to Track KPIs in a BPO Call Centre
Track BPO KPIs in five steps: choose the right metrics, set baselines, automate data collection, review trends, and coach teams based on productivity insights.
1. Choose 6–8 KPIs per client
Start with the SLA and client goals. Tracking too many metrics at once makes it harder to take action.
2. Set a baseline for each KPI
Use around 30 days of reliable data to understand current performance before setting targets.
3. Automate KPI tracking
Manual tracking can lead to outdated reports and missing data. Workforce analytics tools like Flowace help capture metrics such as adherence, utilization, activity patterns, and billable hours automatically.
4. Review trends weekly
A single bad day may not show a real issue. Consistent problems over several weeks can highlight areas that need staffing, training, or process changes.
5. Coach using connected KPIs
Share the KPI result, related metrics, and one clear improvement action with agents. Looking at connected KPIs gives a better view of performance.
Transparency also matters. When agents understand what is measured and why, teams can work toward the same goals with better visibility.
How BPO Teams Use KPI Data in Real Operations
KPI data helps BPO teams make faster decisions, improve service quality, and manage resources better. Here are some practical ways teams use KPI insights:
1. Real-time coaching and customer sentiment
Sentiment analysis helps supervisors understand customer reactions during interactions. Combined with productivity data, managers can identify coaching opportunities and support agents at the right time.
2. Workload balancing and shift planning
Real-time tracking helps managers identify overloaded teams, adjust schedules, and distribute work more effectively. This helps maintain service levels while reducing agent burnout.
3. Early issue detection
KPI trends can reveal rising wait times, call spikes, or performance drops before they become bigger problems. Managers can respond with better staffing and routing decisions.
4. Performance improvement
Productivity insights can help teams recognize strong performance, set improvement goals, and create healthy challenges that motivate agents.
5. Employee well-being support
Work patterns can highlight possible signs of fatigue, such as unusual breaks or changes in focus. Managers can use these insights to provide support before issues grow.
How Flowace Helps BPOs Improve KPI Tracking
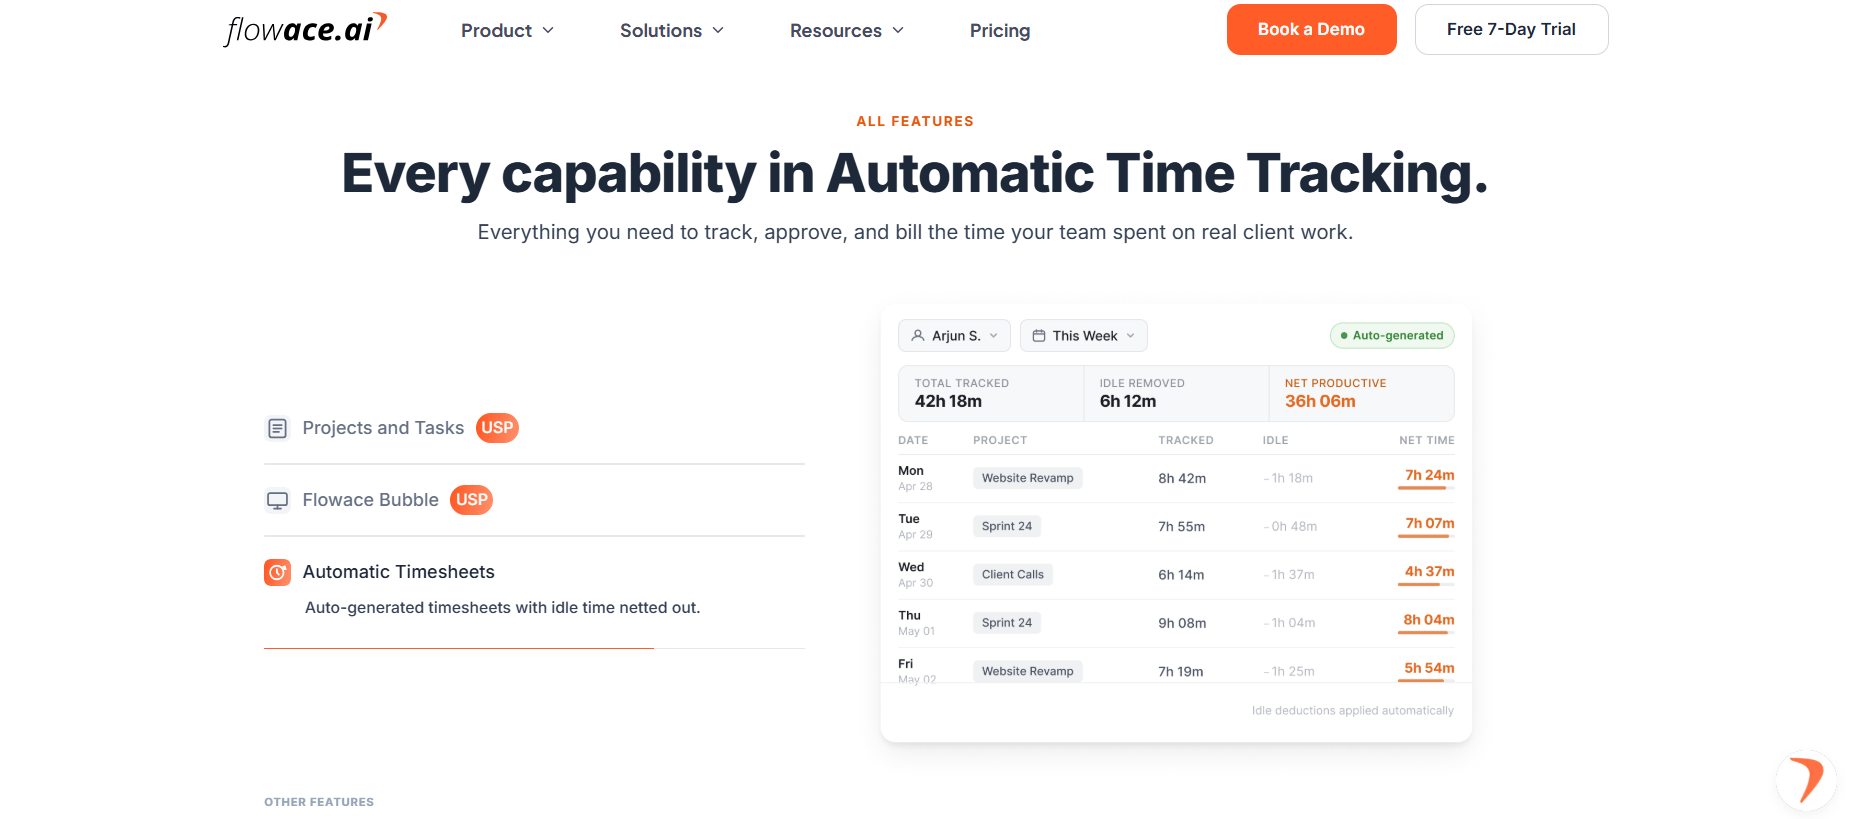
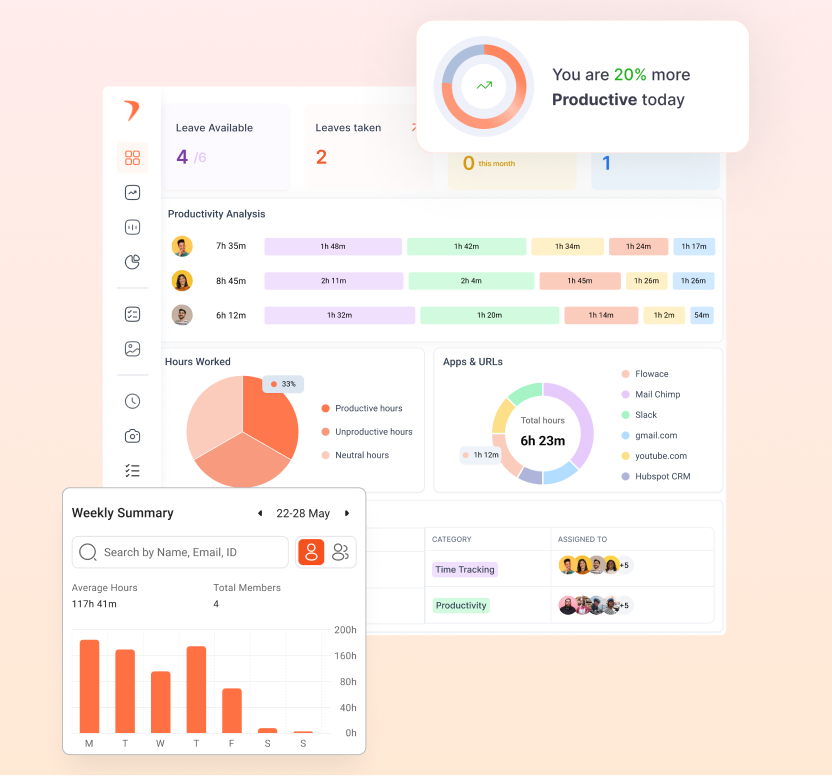
Tracking BPO KPIs manually can lead to missing data, delayed reports, and inaccurate performance insights. Flowace helps teams capture accurate work data with automated time tracking, real-time dashboards, and productivity insights.
With Flowace, BPO managers can:
- Automate time tracking to capture working hours and reduce manual errors.
- Use real-time dashboards to identify productivity gaps faster.
- Analyze productivity patterns with AI-powered insights.
- Create accurate reports for internal reviews and client updates.
Ready to track BPO KPIs with accurate, real-time data?
Start Your 7-Day Free TrialFrequently Asked Questions on KPIs in BPO Call Centre
1. What is the full form of KPI in BPO?
KPI stands for Key Performance Indicator. In BPO call centres, KPIs are measurable metrics that show whether agents and teams are meeting client goals for service quality, speed, and efficiency. Common examples include FCR, CSAT, and AHT.
2. What are the 5 main KPIs in a BPO call centre?
The five common KPIs in BPO call centre are First Call Resolution (FCR), Customer Satisfaction Score (CSAT), Average Handle Time (AHT), service level, and call abandonment rate. These metrics measure resolution quality, customer experience, speed, and call handling performance.
3. How do you calculate KPI in BPO?
BPO KPIs use different formulas based on the metric being measured. A common formula is:
KPI = (Successful outcomes ÷ Total attempts) × 100
For example:
FCR = (Issues resolved on first call ÷ Total calls) × 100
The full formula table above covers all 21 BPO KPIs.
4. What is a good FCR rate in a BPO call centre?
A good FCR rate is usually around 70% to 79%. Many high-performing BPO teams aim for 80% or higher, depending on the industry, call type, and client expectations.
5. What is the 80/20 rule in a call centre?
The 80/20 rule means that 80% of calls should be answered within 20 seconds. It is a common service level target used in many BPO operations and client SLAs.
6. What is the difference between KPI and SLA in BPO?
A KPI measures performance, while an SLA defines the service commitments agreed with a client. BPO teams often use KPI targets such as response time, quality score, and resolution rate to meet SLA requirements.
7. How many KPIs should a BPO call centre track?
Most BPO teams should focus on 6–8 KPIs per client program. Start with the KPIs linked to client goals and SLAs, then add important health metrics such as occupancy and attrition.
8. How often should KPIs be reviewed in a BPO?
Review operational KPIs like service level, adherence, and abandonment in real time when possible. Review agent performance weekly and analyze client-level and financial KPIs monthly.