
BPO shrinkage has a way of looking tidy in a spreadsheet and messy on the floor. One recurring pattern across BPO operations teams is that shrinkage discussions start as staffing conversations but usually turn into visibility problems. Teams often know shrinkage is high before they know where capacity is actually leaking. Most operations leaders can quote the number. Far fewer can point to exactly where it is leaking, or explain it cleanly to a client when it shows up as a service-level miss.
Attendance, activity logs, and structured reporting work best as a single system: clock-in data tells you who showed up, activity data tells you who was actually working, and reporting turns both into something you can defend in a review. The same mechanics apply whether you are running a large voice process or a multi-thousand seat back-office operation. The goal is a framework you can put to work immediately, not another dashboard that sits unused.
TL;DR: How BPOs Can Reduce Shrinkage
- BPO shrinkage is the gap between scheduled and available capacity.
- Attendance data alone cannot identify hidden shrinkage.
- Activity logs reveal pre-shift delays, extended breaks, and idle time.
- Client-ready reporting requires context, not just metrics.
- Combining attendance, activity, and reporting creates a sustainable shrinkage-reduction process.
What Is BPO Shrinkage and Why Does It Keep Climbing?
Shrinkage is the percentage of paid time when agents are not available to handle customer interactions. If you schedule a team of agents for a shift and a significant number are not on the queue at any given moment, you are carrying high shrinkage. That gap between scheduled capacity and real capacity is what drives missed SLAs, unnecessary overstaffing, and the kind of client escalations that burn time across delivery and operations. For a deeper breakdown of how this metric is calculated across different process types, the call center shrinkage breakdown covers the formulas and benchmarks in detail.
According to ICMI’s workforce management research, shrinkage in contact centers commonly falls in the 30% to 35% range, while high-performing operations typically maintain lower shrinkage through stronger workforce planning, schedule adherence, and operational visibility. Rates consistently above 35% usually indicate a structural issue, not a one-off staffing miss.
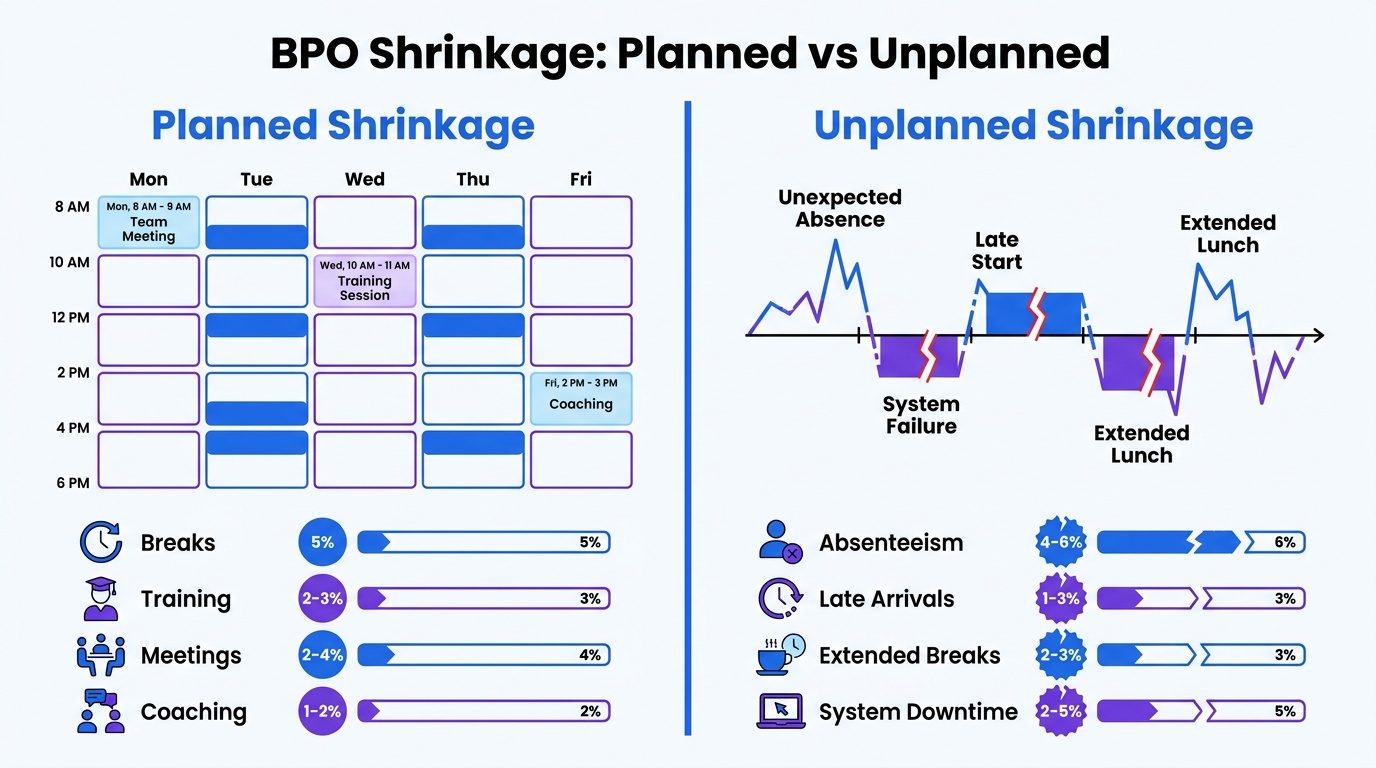
Planned shrinkage is annoying, but it is predictable, which means you can model it. Unplanned shrinkage is what breaks the math. Absenteeism forces the rest of the floor to carry the load, which accelerates burnout, pushes attrition up, and creates a loop that is hard to unwind without better visibility. Most BPOs do not lack policies; they lack consistent, defensible data to enforce those policies without turning every conversation into an argument. According to the American Psychological Association (2023), close monitoring can also be a source of stress, which makes a data-led, non-punitive approach even more important.
Why Attendance Data Alone Is Not Enough
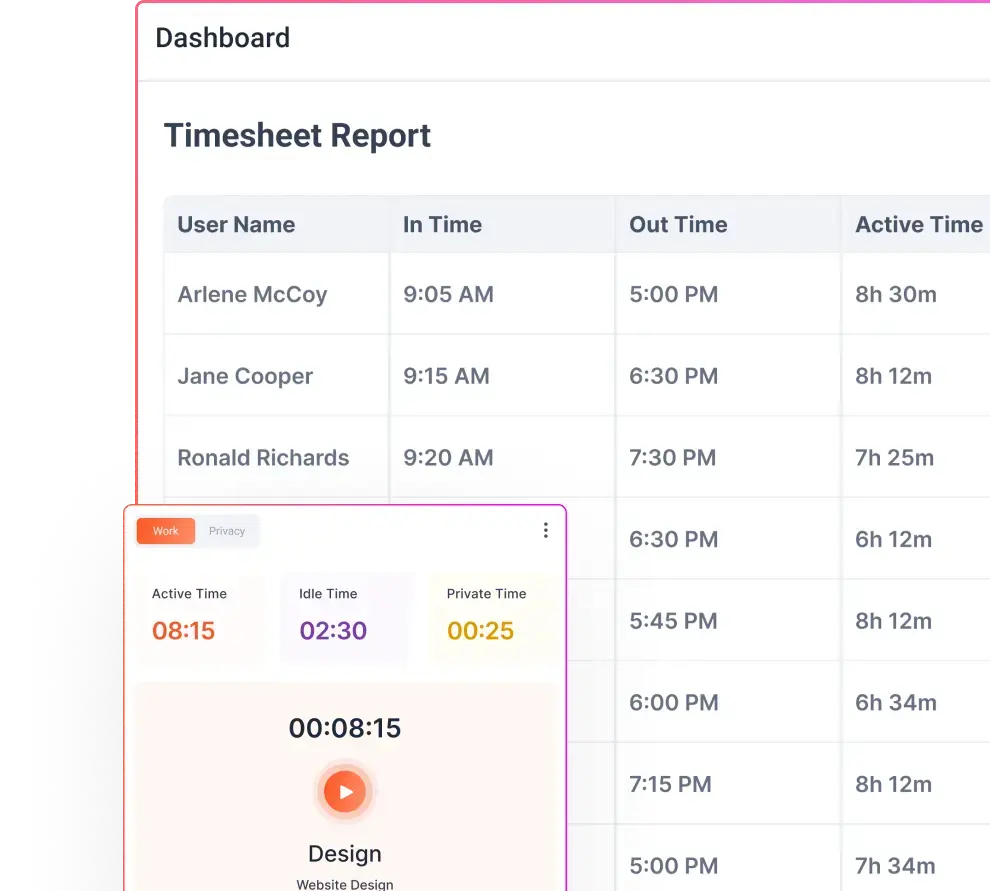
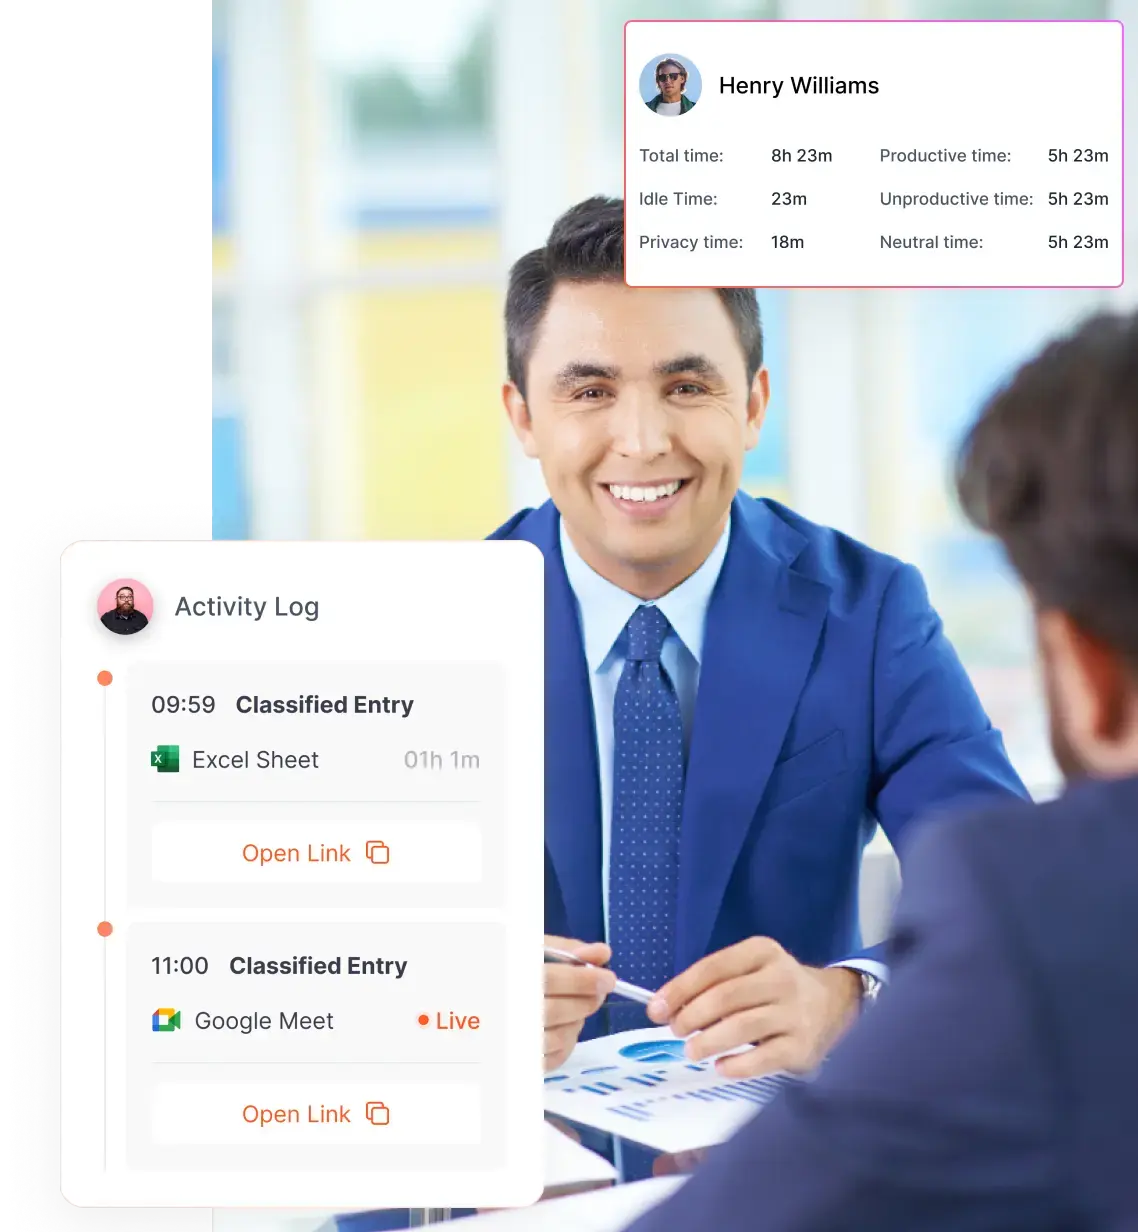
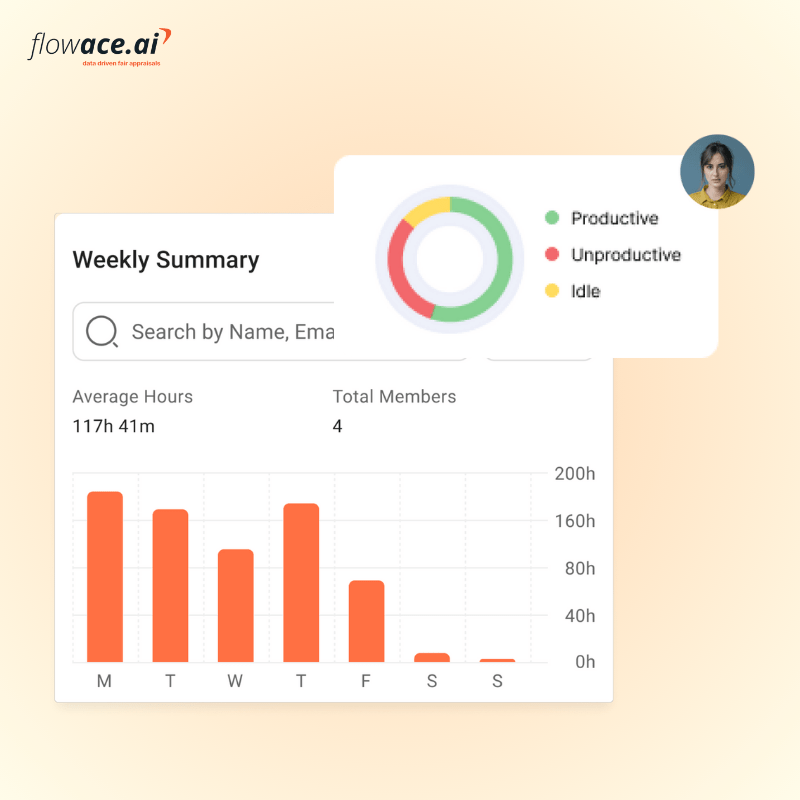
Most BPOs already have attendance covered. There are biometrics, badge swipes, and shift tools everywhere. The catch: those systems prove presence, not availability. An agent can badge in at 9:00 AM and spend a significant amount of time on personal calls, social media, or simply not logged into the queue. Attendance shows a clean check-in. WFM still sees a hole in coverage. And because the data sits in different places, the story never lines up.
That gap is exactly where user activity monitoring earns its keep. Activity logs show what happens after the clock-in: which applications are open, how long agents stay in them, when they go idle, and when they are actually on productive work. Layer activity data over attendance and you stop guessing where shrinkage is coming from.
You see this all the time in BPO operations: attendance may show high adherence, but activity logs show productive utilization is much lower. That gap does not show up in any clock-in/clock-out report. It shows up downstream as SLA misses, handle time drift, and client CSAT pressure, and without the underlying detail you end up debating symptoms instead of fixing causes.
How Activity Logs Expose Hidden Shrinkage
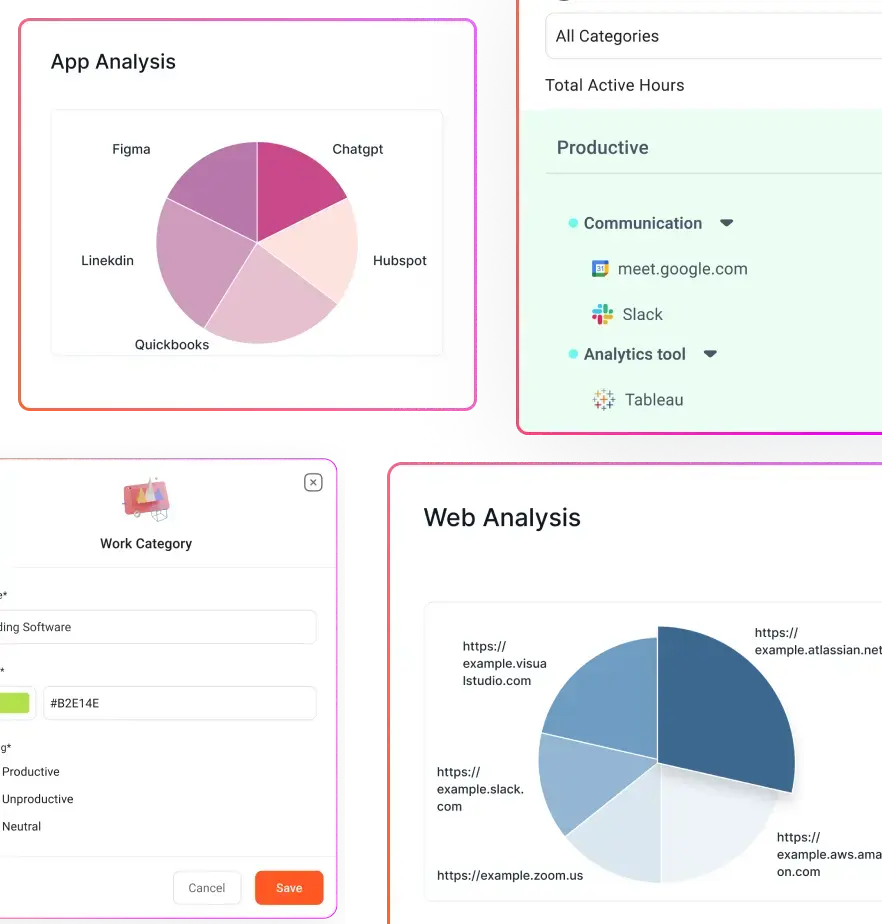
Activity logs capture application-level and system-level behavior across the workday. In a BPO setting, the signals are practical: time logged into the telephony platform, time in the CRM, time in ticketing or back-office systems, idle time, and time spent in non-work applications. Roll that up across a team and the patterns show themselves fast.
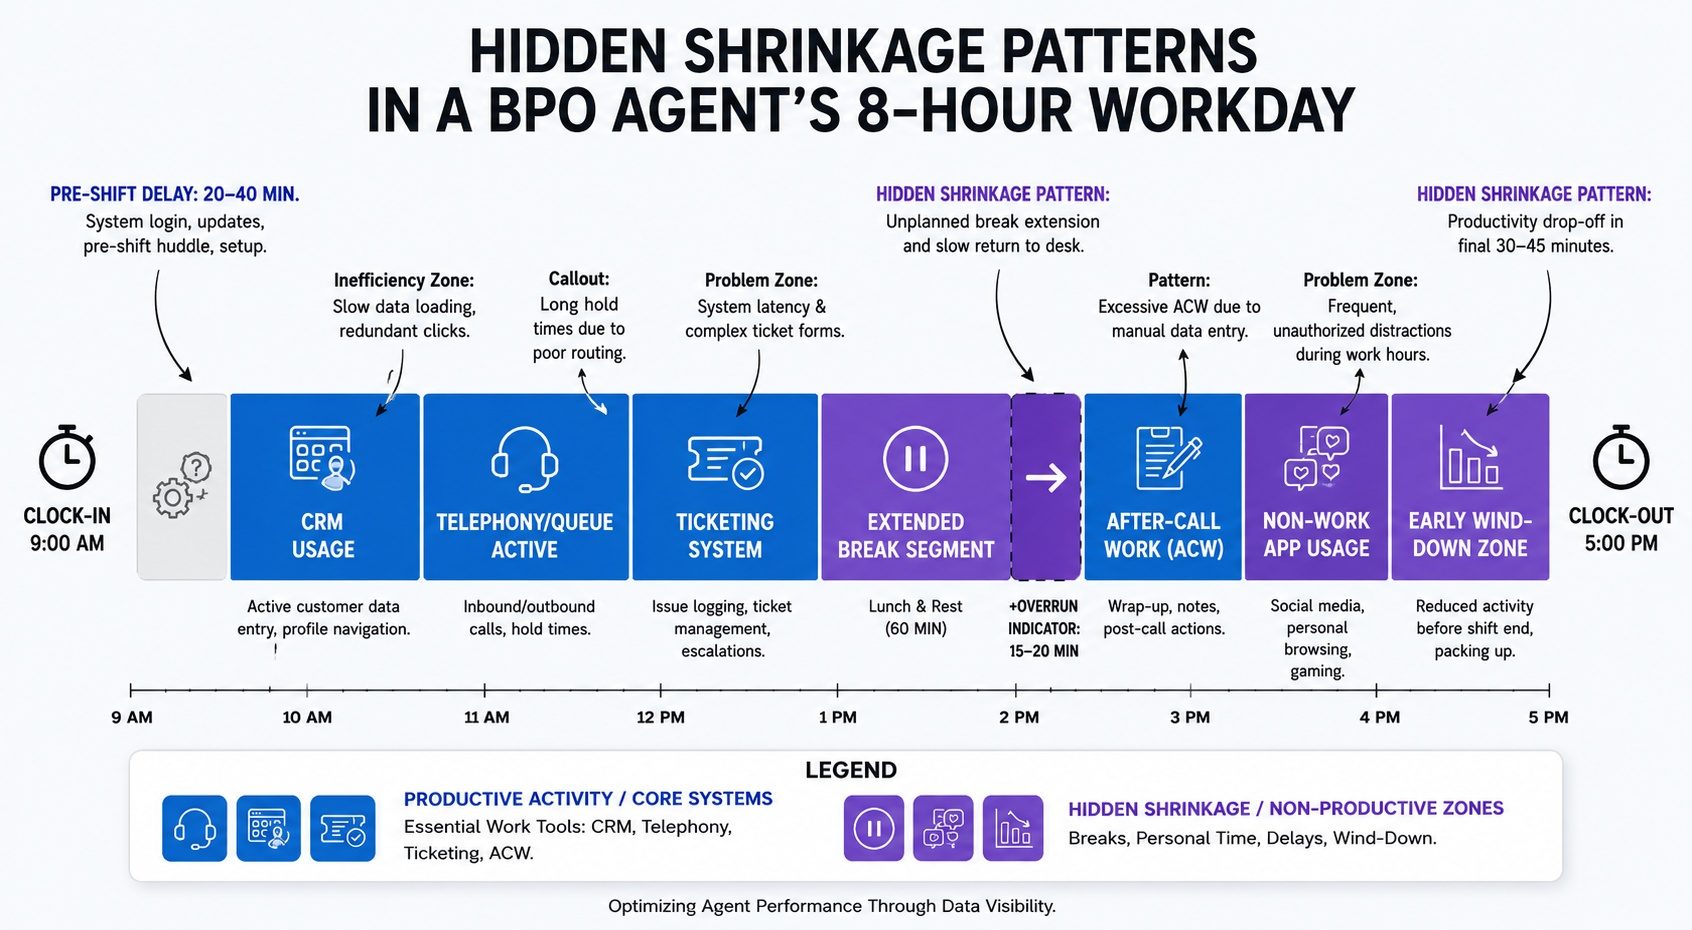
The most common hidden shrinkage patterns that activity logs surface in BPO environments:
- Pre-shift delay: Agents clock in on time but take a significant amount of time before logging into the queue or opening work applications.
- Extended break creep: Scheduled breaks that consistently run longer than allotted, invisible in attendance records.
- Post-call avoidance: Agents staying in after-call work (ACW) status longer than necessary to avoid taking the next interaction.
- Application switching: Frequent toggling between work tools and non-work sites during active shift hours.
- Early wind-down: Agents closing work applications well before the shift officially ends.
None of that shows up as absenteeism, but all of it eats capacity. Once you can quantify it at the individual and team level, you can manage it before it becomes an SLA problem. That is the shift from reacting to misses to preventing them. And on the attendance side, preventing proxy attendance is a related issue that hybrid BPO teams run into more often than they expect.
How Flowace uncovered hidden capacity leakage
In one RCM operation, the team looked fully staffed on paper, but Flowace revealed that a large share of working hours were not going toward core claim-related work. Activity visibility helped the team identify 30-35% non-claim hours, reduce idle and non-productive time, and recover the equivalent capacity of one full-time employee without adding headcount.
The same lesson applies to BPO shrinkage: attendance data may show that people are present, but activity logs show whether paid time is actually moving work forward. When teams can see where capacity is leaking, they can fix the process before it turns into an SLA problem.
Read the full case study: How a US RCM provider found hidden billing capacity leakage
The Visibility-to-Action Shrinkage Model
A better approach is to treat shrinkage as an operations data problem, not a morality play. The Flowace Visibility-to-Action model connects data layers to operational responses, ensuring that every insight leads to a specific, measurable action. The point is not to hunt for violations, but to find where capacity is leaking and remove the conditions that make it easy for that leakage to continue.
| Layer | What You Measure | What You Do With It |
|---|---|---|
| Layer 1: Attendance Visibility | Clock-in/out records, absenteeism, late arrivals | Establish baseline presence and schedule adherence. |
| Layer 2: Activity Visibility | Productive vs. idle time, application usage | Identify hidden shrinkage between clock-in and clock-out. |
| Layer 3: Operational Diagnosis | Idle time patterns, ACW duration, process bottlenecks | Separate behavioral issues from system or process friction. |
| Layer 4: Client Reporting | Shrinkage trends, cause analysis, intervention impact | Translate internal data into a clear, defensible client narrative. |
| Layer 5: Continuous Improvement | Weekly trend monitoring, SLA correlation | Confirm what is working and adjust before the next review. |
Layer 3 is where many BPOs stall. The team identifies a gap, then defaults to policy reminders. A better move is to read the activity data as a signal of friction. If agents are regularly idle between interactions, queue routing could be the issue. If ACW is inflated, the CRM workflow may be the bottleneck. Fixing the system often brings shrinkage down faster than trying to police every individual minute.
If attendance fraud is part of the picture, pairing activity monitoring with a structured attendance improvement plan gives you both sides of the equation: detection and a documented path to correction.
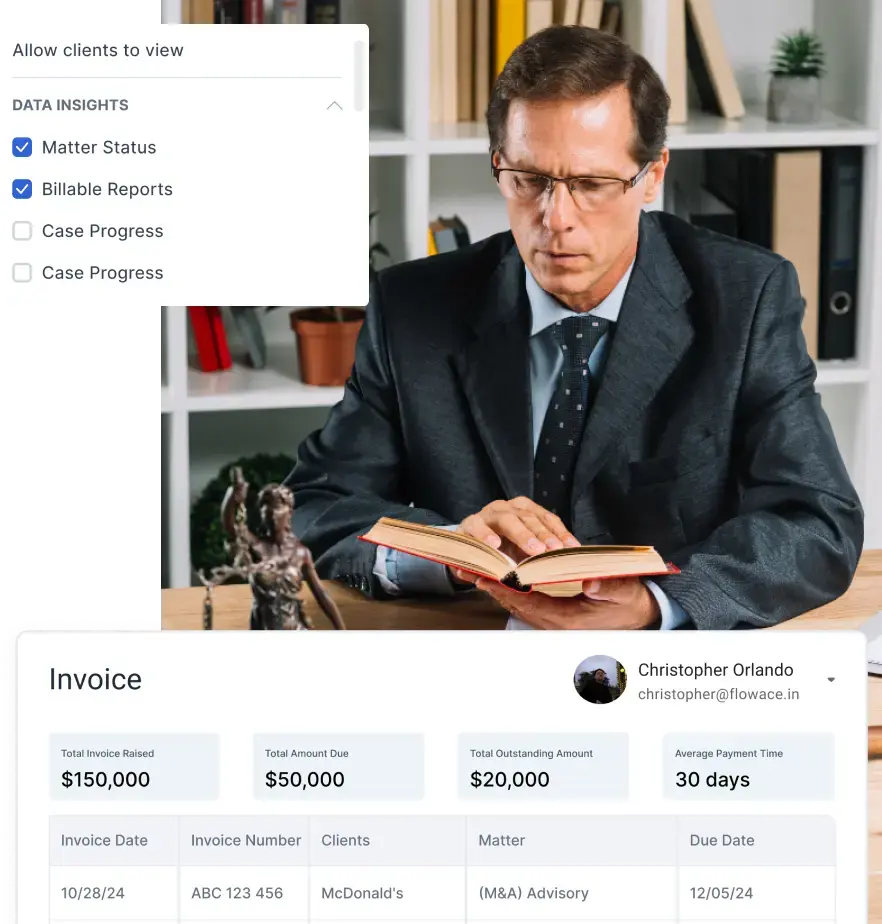
What Client-Ready Reporting Actually Requires
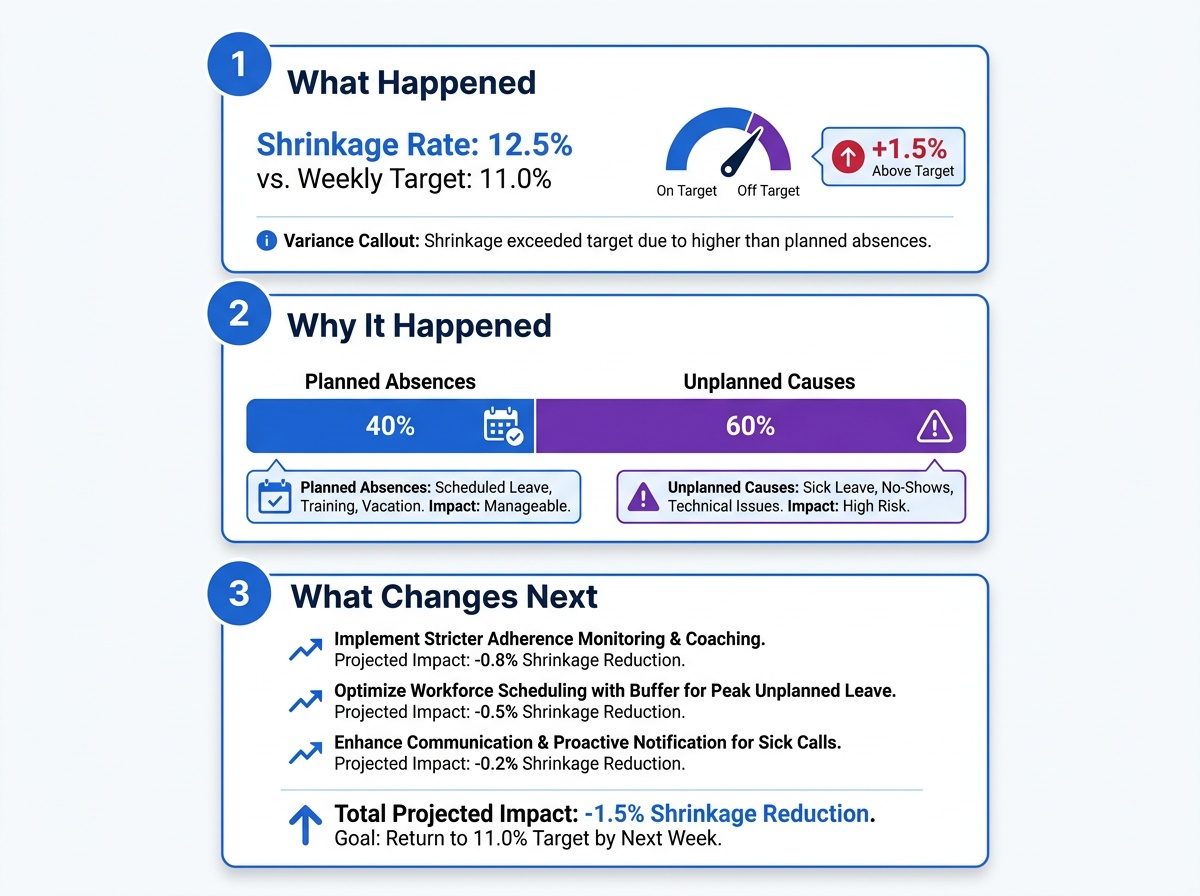
Client-ready reporting requires clear attribution, trend visibility, and operational context so stakeholders can understand what happened, why it happened, and what actions are being taken next. Unlike internal analytics, which assume the reader knows the floor realities, client reports must stand on their own. What matters is clarity and narrative, not dumping more data into a deck.
When a client asks why SLAs slipped last week, “we had higher than expected absenteeism” is rarely enough. A client-ready shrinkage report needs to answer three questions: what happened, why it happened, and what you are doing next. That structure only works if the underlying data is clean, attributed, and tracked over time.
The employee productivity reports framework is a solid starting point for building that output. The approach is familiar to any delivery leader: roll up individual signals into team and process summaries, add the context that explains the numbers, and show trends instead of one-off snapshots.
How Flowace Connects Attendance, Activity, and Reporting for BPO Teams
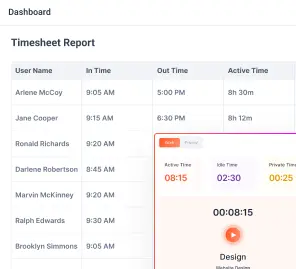
Flowace connects attendance, activity monitoring, and reporting in a single system so BPO teams can identify shrinkage drivers, track utilization, and produce client-ready reporting without manually combining data from multiple tools. For most BPO operations teams, the day-to-day problem is fragmentation: attendance sits in one tool, activity data sits somewhere else (or nowhere), and reporting gets stitched together in spreadsheets before every client call. That overhead becomes its own form of shrinkage, because time spent reconciling numbers is time not spent fixing what is driving the miss.
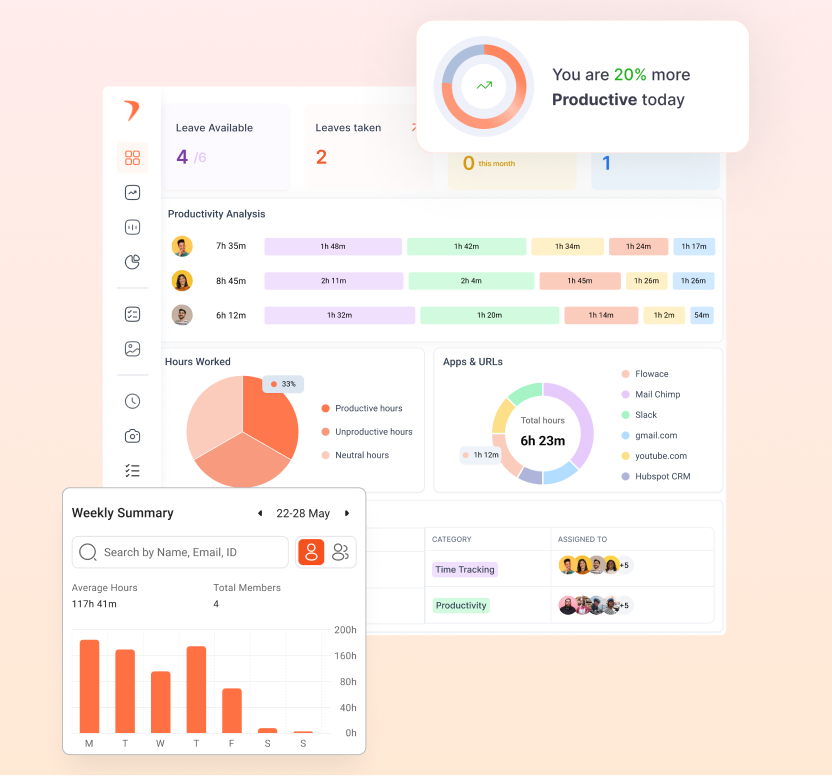
Flowace helps BPO teams understand workload distribution, utilization patterns, attendance behavior, and client-specific performance trends from a single operational view instead of forcing managers to reconcile data across multiple systems. Attendance is tracked automatically with real-time visibility into who is present, who is late, and who has not logged in. Activity logs add application-level detail on productive and non-productive time, so managers can separate a system constraint from a behavior pattern. Reporting is generated automatically, with exportable client-facing summaries that cover shrinkage trends, schedule adherence, and productivity metrics without the manual compilation drill.
Activity logs create an auditable record you can use in internal reviews and, when needed, in client conversations at an aggregated level. The platform is built for distributed and hybrid teams, which matches how many Indian BPOs operate now: agents split across sites, or working from home, or rotating between both.
Flowace supports teams ranging from growing BPO operations to large enterprise deployments, with capabilities designed for distributed and hybrid work environments. Teams running automated time tracking software for call centers alongside Flowace’s reporting layer often move faster on unplanned shrinkage because the feedback loop between data and action is shorter.
Common Mistakes BPOs Make When Trying to Reduce Shrinkage
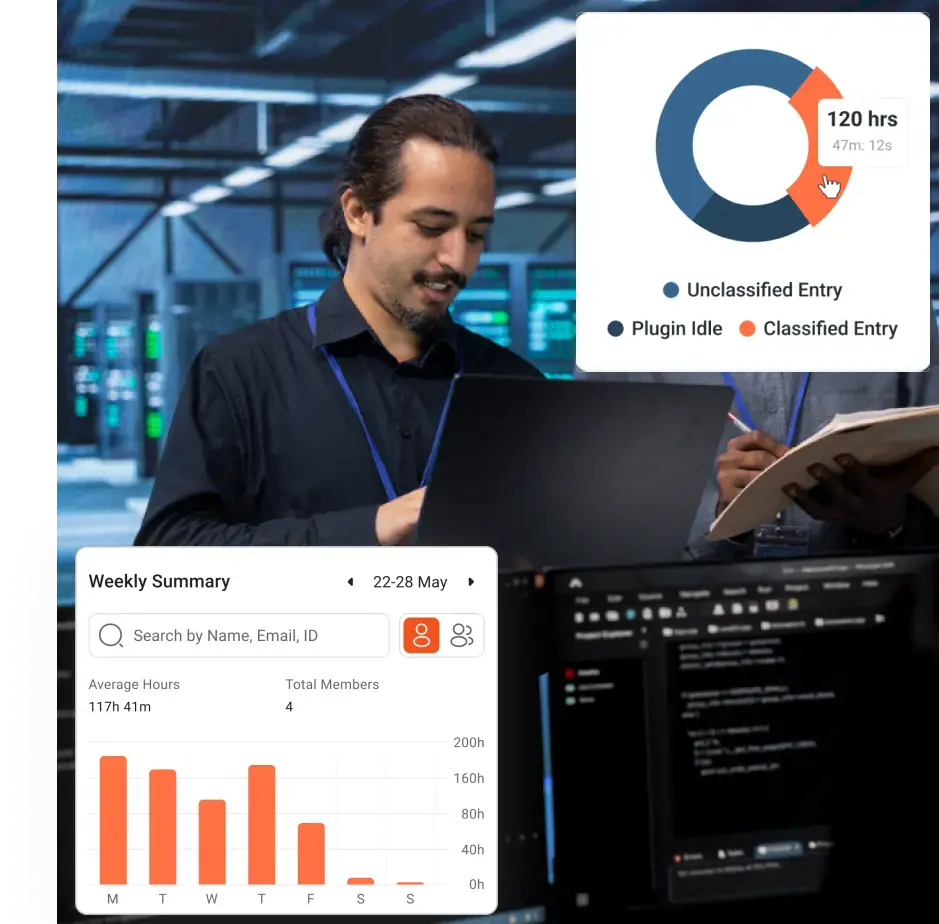
![]()
Shrinkage reduction efforts often fail when teams have data but draw the wrong conclusions from it. The most common miss is treating shrinkage as a headcount or discipline issue. If shrinkage is high and the response is to hire more agents and issue attendance warnings, you have not fixed the leak. You have raised cost, irritated the floor, and left the underlying drivers untouched.
Another mistake is reporting shrinkage as a single blended number. An illustrative shrinkage rate that is mostly planned is a very different operating situation than one made up of mostly unplanned issues. One is being managed. The other is a structural problem. Clients and internal stakeholders need the split, not just the headline.
The third mistake is ignoring process-level causes. If the telephony platform regularly fails at login, agents rack up idle time that looks like behavior-driven shrinkage but is really a technical constraint. Activity logs that capture system events alongside agent behavior let you separate the two and route the fix to the right owner.
What to Do Next
What to take from this guide and apply immediately:
- BPO shrinkage averages 30 to 35% globally. High performers hold it at 20 to 25%. The difference between those ranges is where margin and service stability disappear.
- Attendance data tells you who showed up. Activity logs show what happened after clock-in. You need both to manage shrinkage with confidence.
- Unplanned shrinkage is the lever you can actually pull. Start measurement and intervention there.
- Client-ready reporting needs a narrative, not a data dump. Structure shrinkage reporting around what happened, why, and what changes next.
- Shrinkage is usually a system problem before it becomes a people problem. Remove process bottlenecks and data blind spots before escalating to discipline.
- A platform that unifies attendance, activity, and reporting removes manual reconciliation work that slows down decisions.

Frequently Asked Questions on BPO Shrinkage
1. What is a good shrinkage rate for a BPO?
Strong BPO and call center operations typically run shrinkage between 20% and 25%. The global average, according to ICMI benchmarks, is 30% to 35%. Once you are consistently above 35%, it usually points to a structural issue in attendance management, scheduling, or workforce processes. Targets also vary by process type: high-volume inbound voice work generally needs tighter control than back-office teams with more flexible scheduling.
2. How do activity logs help reduce BPO shrinkage?
Activity logs show what agents do after they clock in: which applications they use, how long they are idle, and when they are actually available for work. That visibility surfaces hidden shrinkage patterns like pre-shift delays, extended breaks, and post-call avoidance that attendance tools do not catch. With user activity monitoring, operations managers can separate behavior-driven shrinkage from process-driven constraints and act on the right root cause.
3. What should a client-ready shrinkage report include?
A client-ready shrinkage report should cover the overall shrinkage rate for the period, the planned vs. unplanned split, the specific drivers of unplanned shrinkage such as absenteeism, late arrivals, and system downtime, a trend line over time, and the interventions being taken to close the gaps. Clients are not looking for raw logs; they need context and a clear plan tied to the numbers.
4. How is BPO shrinkage different from absenteeism?
Absenteeism is one driver of unplanned shrinkage: agents not showing up for their scheduled shift. Shrinkage is broader. It includes any paid time when agents are not available for work, including planned items like breaks and training, and unplanned items like late arrivals, extended breaks, and system downtime. Absenteeism matters, but it is not the whole picture.
5. Can shrinkage data be used in client conversations without exposing internal operational details?
Yes, as long as you aggregate and add context before sharing. Clients do not need agent-level detail; they need process-level trends like weekly shrinkage, the breakdown by cause category, and how the trajectory is moving over time. Tools that generate automated client-facing summaries from operational data make that separation easier to maintain. The employee productivity reports framework is a useful reference for structuring this kind of output.