How a global insights firm stopped leaking ₹169L a month
The idle cost was rising every quarter, and one team was already in freefall. The org average somehow absorbed all of it, and reported stability. Flowace showed what was actually happening underneath.
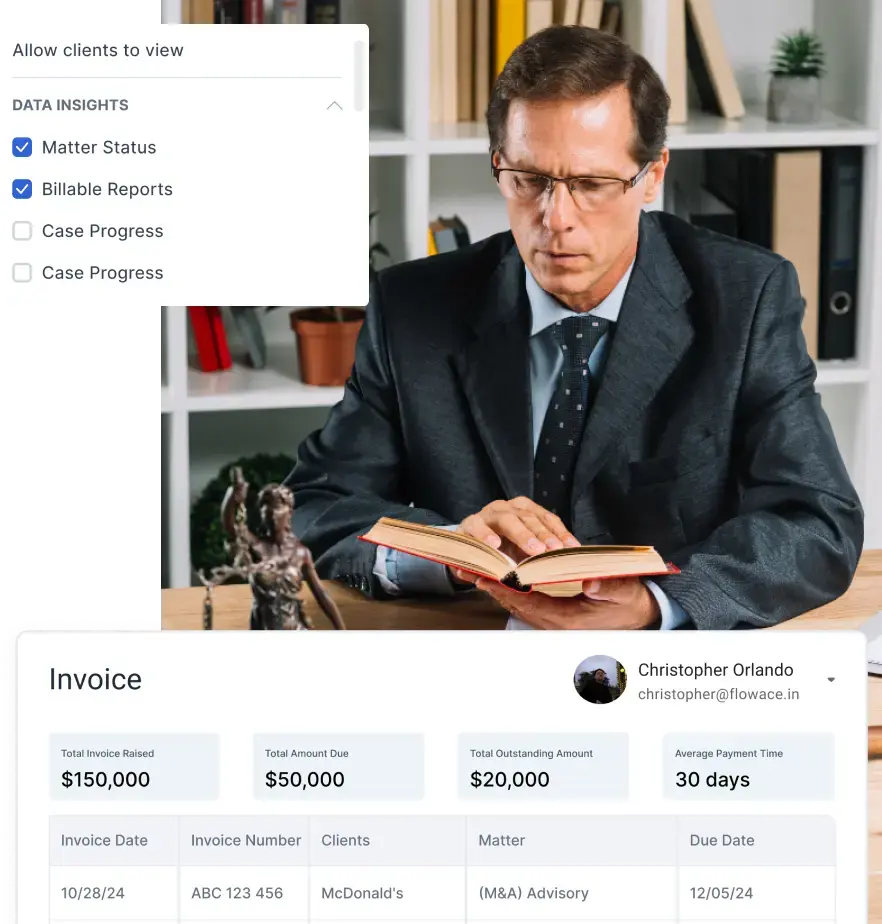
Try Flowace FreeAbout The Client
The client is a global data and insights firm serving Fortune 500 clients, operating across multiple offices in India and the US. At this scale, idle time compounds until the cost is structural, and the org average is the last thing telling you so.
Nine months of rising idle, and not one alert was triggered
The client had 22 delivery teams and one number summarising all of them. The org average moved within a narrow band, never specific enough to act on. Underneath it, idle time was rising: 24.1% in Q1, 25.1% in Q2, 30.1% in Q3. By Q3, ₹169L a month was leaving the business in unproductive hours.
The team-level reality was more alarming. A 57.7 percentage point spread separated the best-performing team from the worst.
The structural problem was the absence of an early warning system. There was no mechanism to catch drift at the first deviation, no threshold alert or signal that distinguished a one-period dip from a directional decline.
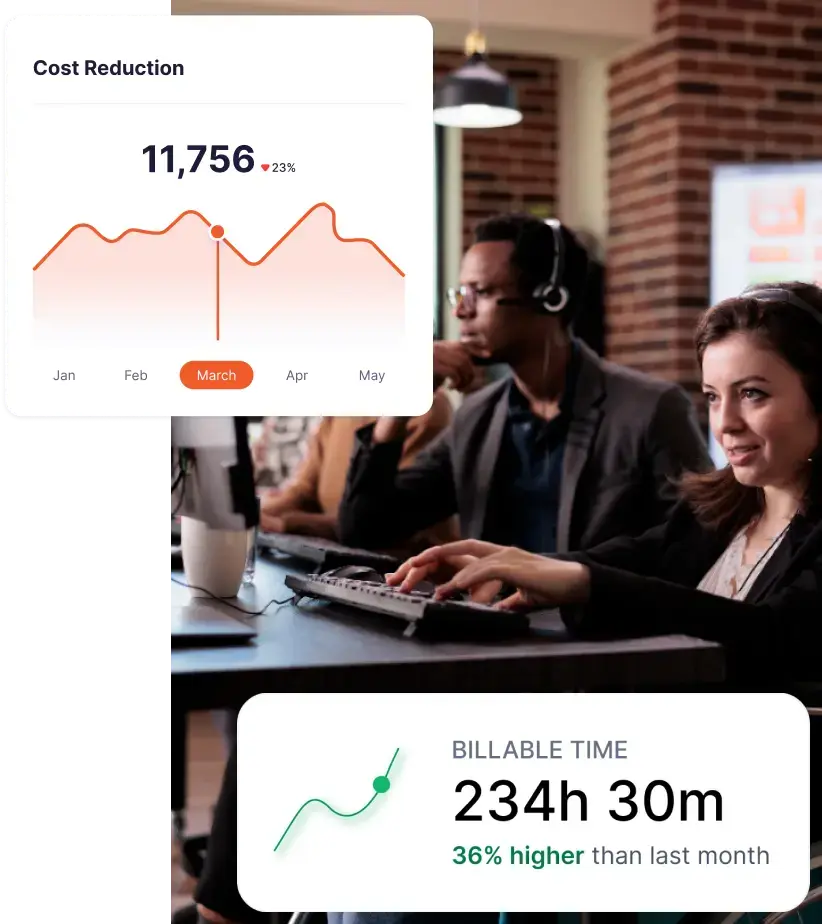
₹169L leaving every month silently
Idle cost rose from ₹117L to ₹169L between Q1 and Q3, a ₹52L monthly increase that accumulated with no mechanism to detect, attribute, or address it.
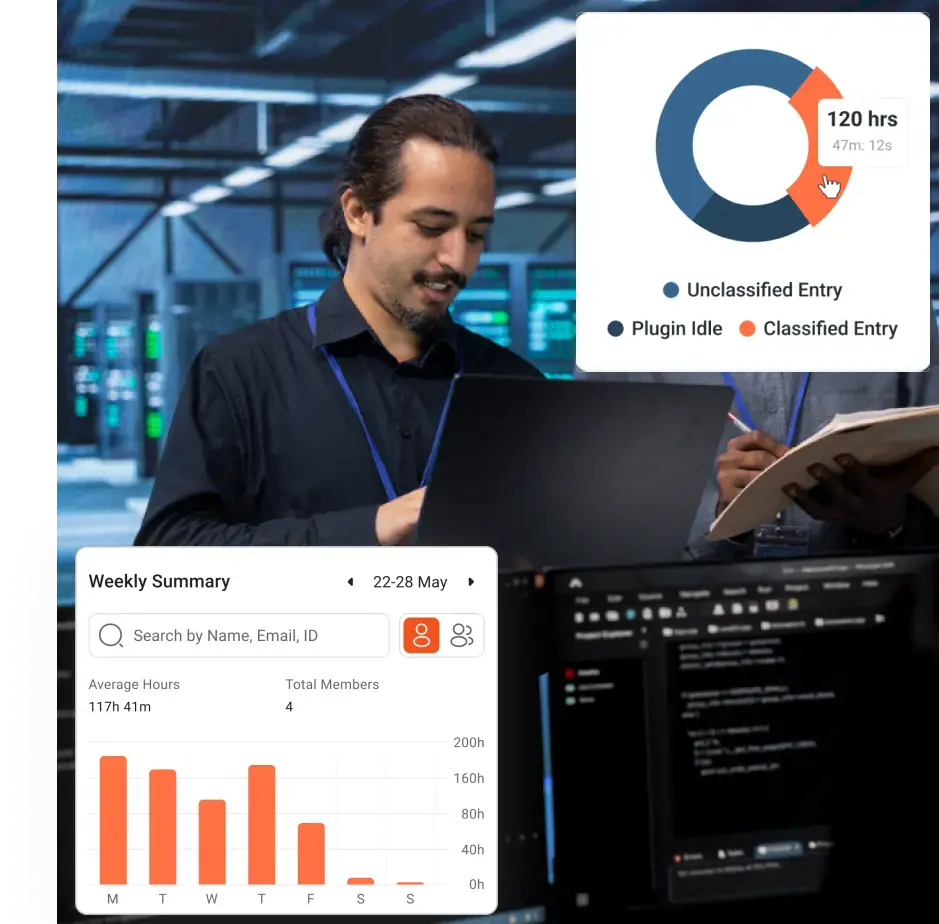
22 teams, one average, zero team visibility
A 57.7pp spread between best and worst teams was completely invisible inside the org average. The best team ran at 87.7% productive.
Major client catalogue declined every quarter
67% → 66% → 59% productivity. Idle rising 28% → 29% → 36%. Every quarter worse than the last, with no alert, no flag, and no intervention triggered.
“We had 22 teams performing very differently. We had one number telling us how we were doing. Those two things were never going to produce the right answer.”
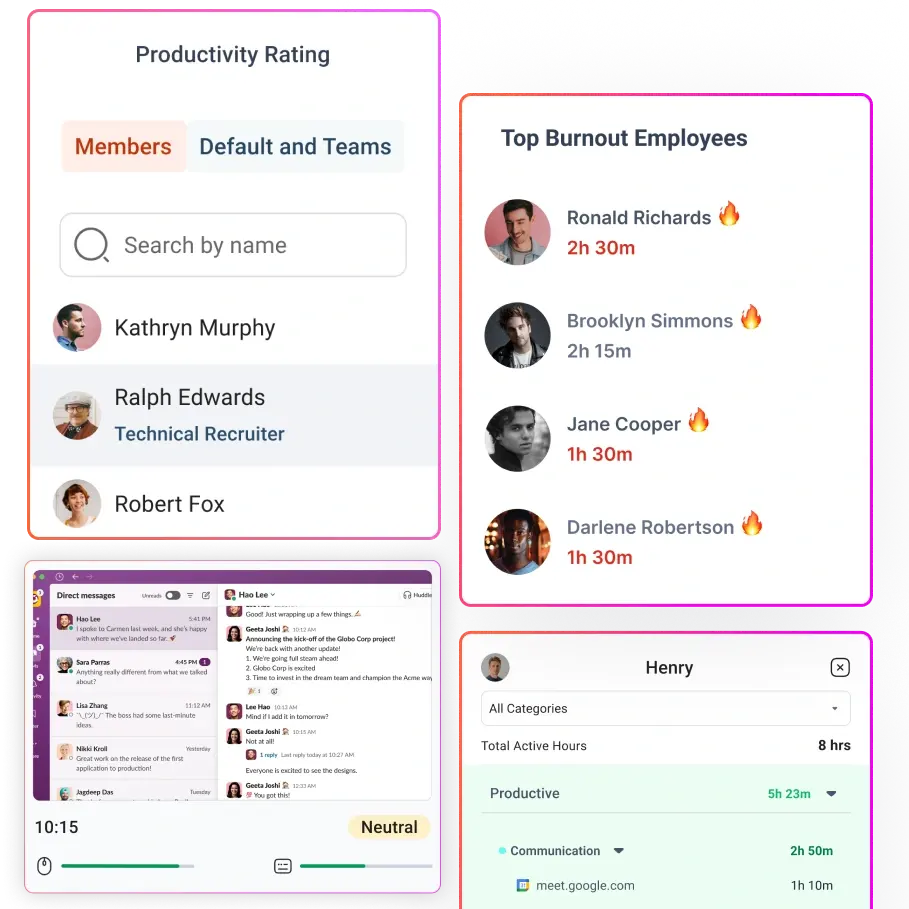
Flowace made the quiet climb impossible to ignore
Three things changed when the client finally had visibility at the team level.
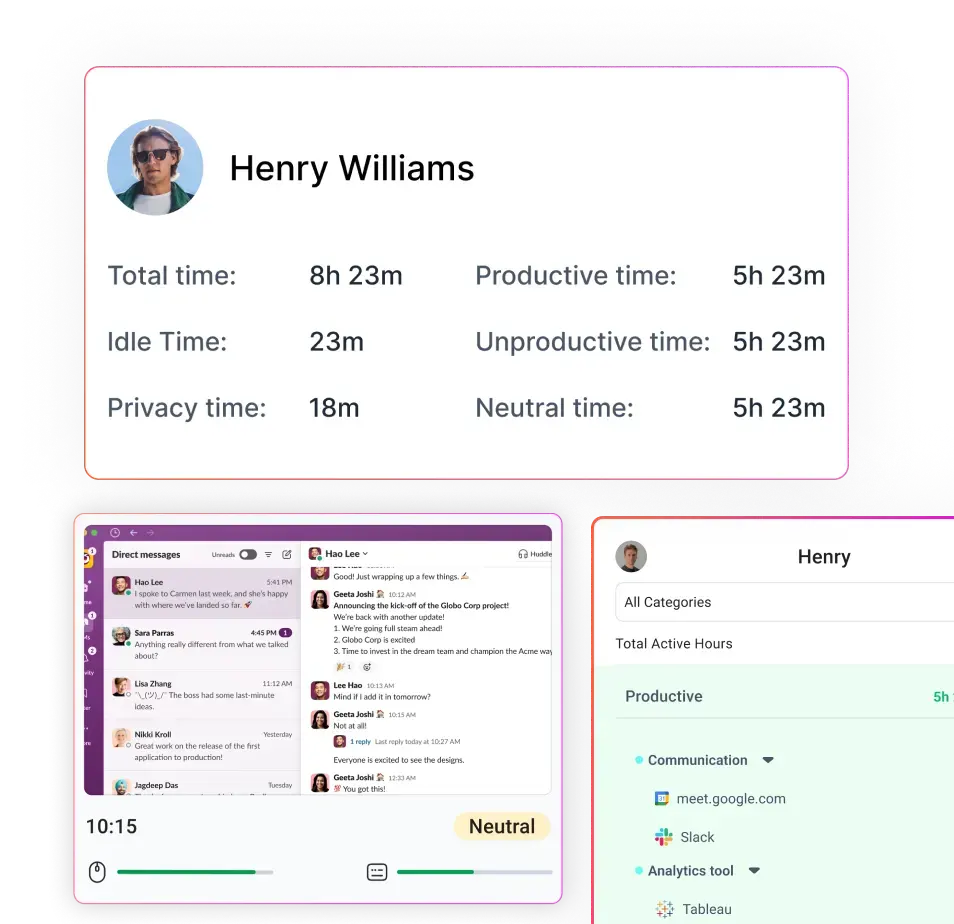
The best-performing team's benchmark after Flowace
Before Flowace, no team knew where it stood relative to any other. Major client’s QC's 87.7% productive rate, with just 10.2% idle, was invisible inside the org average, surfaced by Flowace.
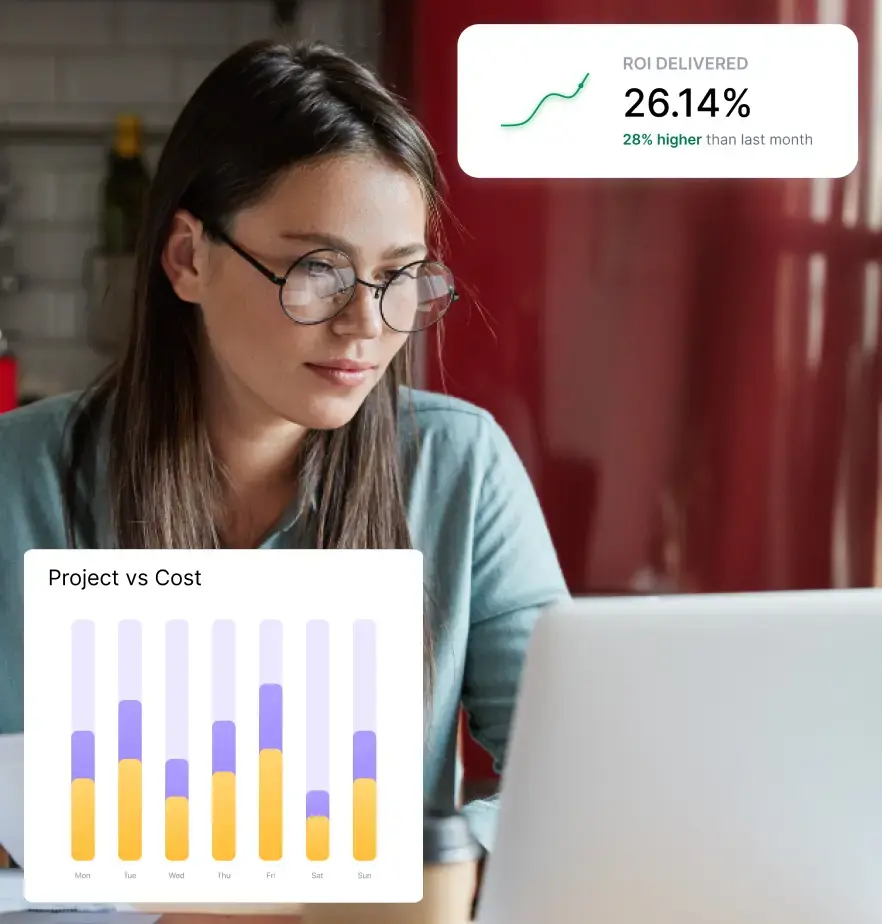
recovered per month for every 1% idle reduction
At 30.1% idle and ₹169L/month in unproductive cost, the recovery lever is precise: 6pp back to Q1 baseline returns ₹52L every month. Full recovery to best-team standard returns ₹111L. Flowace made both targets measurable for the first time.
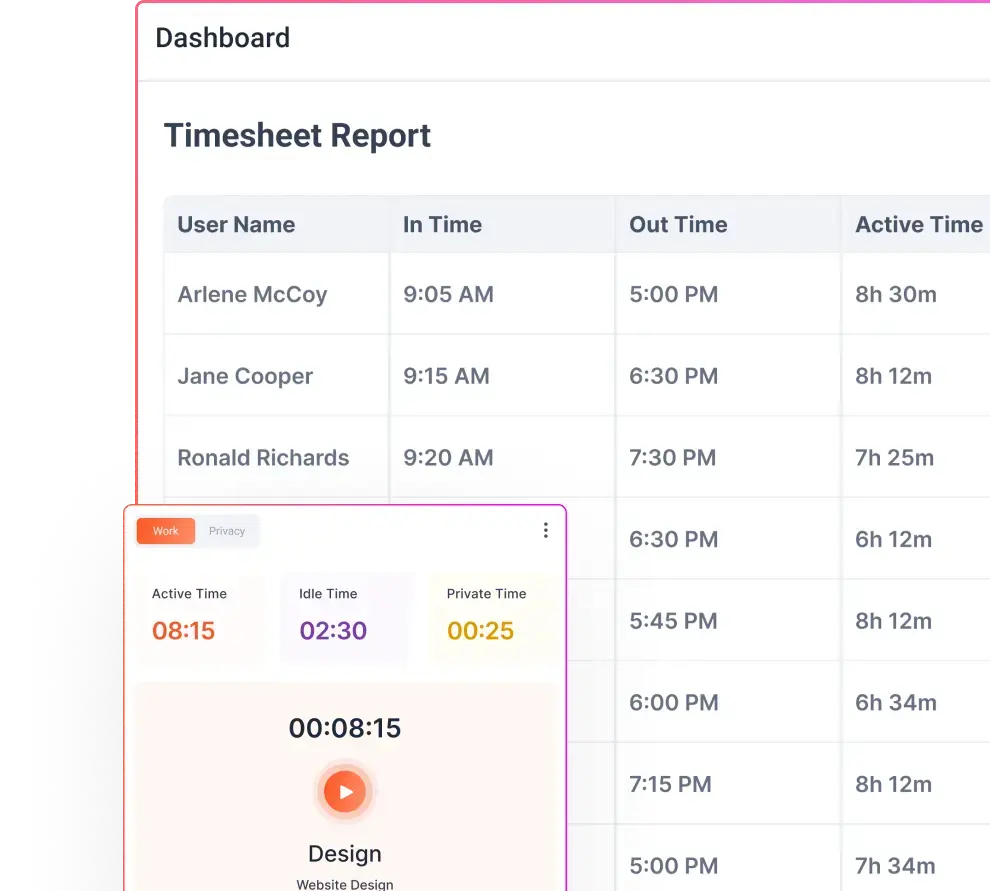
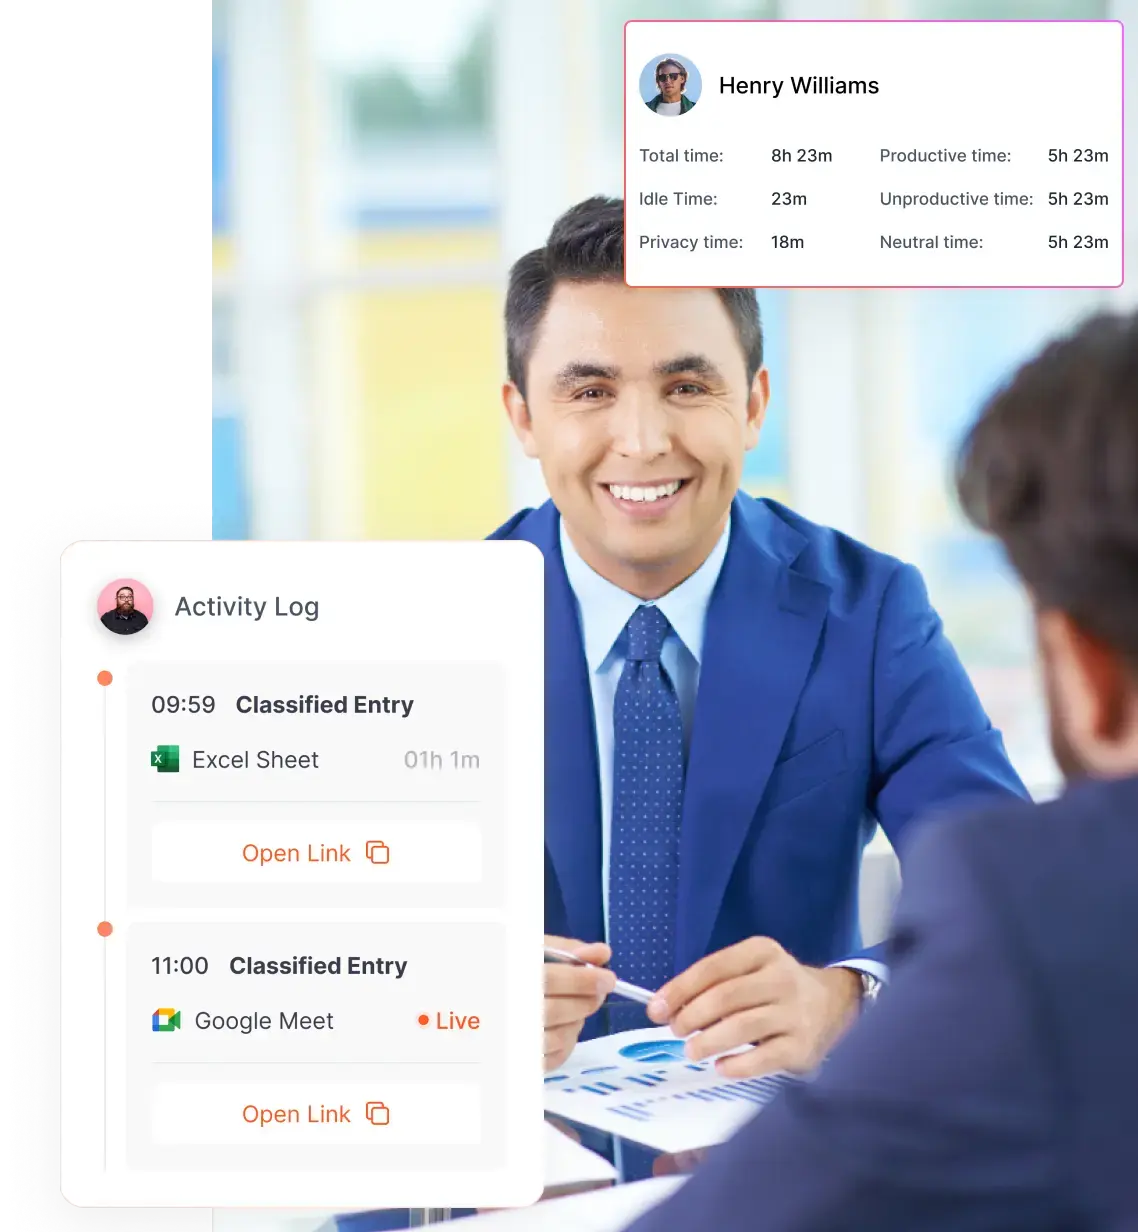
Unowned before, made attributable
Now every rupee is attributable by team, by person, and by period, turning a number that once disappeared into averages into a line item leadership can act on.
The client had a resolution problem. Twenty-two teams performed across a 57.7 percentage point spread, idle rising every quarter, none of it was visible in the number leadership was reviewing. Flowace changed the granularity at which the operation could be seen, and at the scale of a Fortune 500 supplier with ₹119Cr in revenue and 22 client delivery teams, that’s the difference between catching a problem and inheriting one.
FAQ's
Frequently Asked Questions About the Global Insights Firm Case Study by Flowace
Flowace helped the firm find ₹169L in monthly idle time cost and uncover productivity gaps across 22 delivery teams. It revealed a 57.7 percentage point productivity gap hidden by company-wide averages.
Average productivity scores can hide problems because strong teams can cover weak team performance. Flowace shows team-level data to help companies find issues earlier.
Companies can identify declining productivity by tracking team performance trends. Flowace helps managers find productivity drops before they affect delivery quality or client relationships.
Productivity can vary widely between teams in large companies. One insights firm found a 57.7 percentage point gap between its highest and lowest-performing teams using Flowace.
Yes. Flowace helps companies measure the value of reducing idle time. This data insights firm found that every 1% reduction in idle time was worth ₹5.63L per month.
Flowace offers features like team productivity tracking, time tracking, activity reports, dashboards, historical data, custom reports, and workforce analytics. These features help enterprises improve visibility across large teams.
Flowace pricing depends on team size, features, and business needs. Enterprise plans include custom pricing, private cloud options, and dedicated support for large organizations.
Enterprise is best for large organizations that need custom solutions, security options, and dedicated support. Premium is suitable for growing teams that need advanced reports and historical tracking.
How many of your teams are declining inside your average?
Most data and insights firms find a 40–60pp performance spread across teams in their first Flowace report.
- 7-day free trial
- No Credit Card Required
- Live in under 5 minutes.