Enterprise-grade security backed by GDPR, HIPAA, ISO 27001 & SOC 2 compliance. Know more

You're pricing on a cost you've never measured
Research and data teams price, staff and report on averages that bury the truth. Flowace measures idle cost, analyst utilisation and real cost per deliverable, team by team.
- Free 7-day trial
- No credit card required
Trusted by teams at















Use cases
Find the signal your averages bury
A healthy headline number can hide a loss-making study and a team at breaking point. Flowace shows the detail beneath it.
Idle cost by team
See the team going under before your average admits it
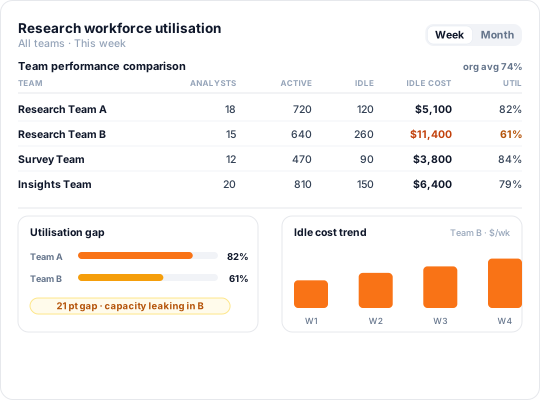
A steady org average hides ₹169L a month and a 57.7pp gap between teams, so Flowace tracks idle cost and Analyst Utilisation per team to flag drift early.
- Idle cost attributable by team, person and period
- Analyst Utilisation compared team against team
- 57.7pp spread surfaced from inside one org average
Cost per deliverable
Know what your core output actually costs to produce
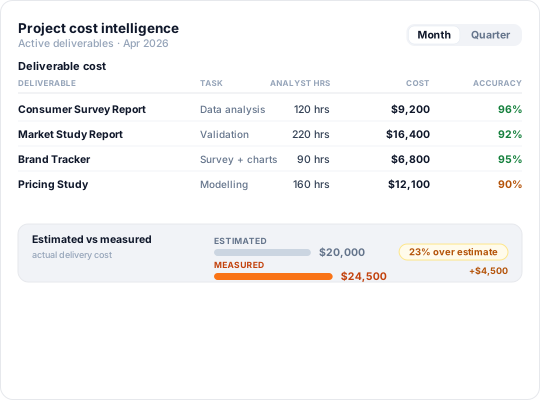
Unmeasured analyst time turns pricing into guesswork. Flowace tracks task-level time, so cost is measured, not assumed.
- Task-level time behind every deliverable
- Project Costing Accuracy built on measured hours
- One platform's unit cost ran up to 46% over estimate
Verified activity
Tell active work from an app left open
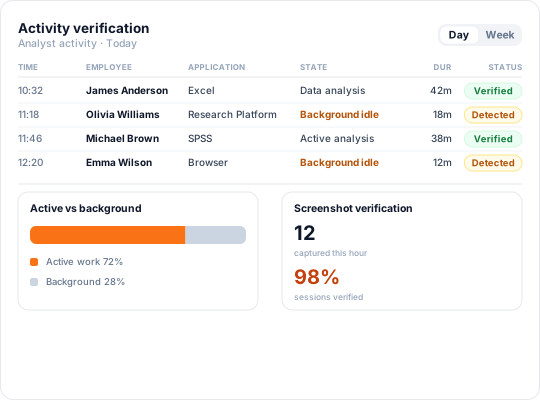
An open tool is not work done. At one firm, 35% of “productive” hours sat idle in the background. Flowace pairs activity with periodic screenshots, so work is verified.
- Periodic screenshots verify active vs background time
- 35% of “productive” tool hours were idle, surfaced
- Payroll runs on system records, not Excel logs
Trust at scale
Keep records that stand up to a client audit
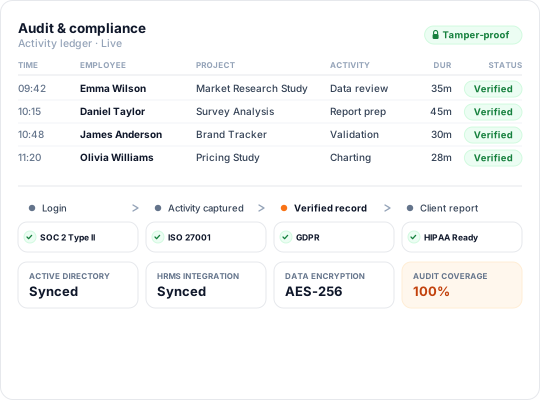
Flowace keeps raw, tamper-proof logs in a SOC 2, ISO 27001 and GDPR-aligned framework, so every number traces back to captured activity
- Silent background capture, consistent across teams and geographies
- Raw activity and screenshot records that survive a client audit
- SOC 2 Type II, ISO 27001, GDPR compliant and HIPAA ready
- Active Directory and HRMS sync for a clean rollout
See what your average is hiding in 30 days
Most insights firms find a 40–60pp spread across their teams.
Book a demoIntegrations
Works with the tools your analysts use
Flowace connects to your HRMS, payroll, project and BI tools, so utilisation and cost data land where your delivery and finance leaders already look.
See All IntegrationsCase studies
How different teams measured for the first time
One firm surfaced ₹169L in monthly idle cost. Another found unit cost 46% over estimate.

₹169L Monthly idle cost surfaced, yet never quantified before
- 57.7pp Productivity spread across 22 teams invisible inside the org average
We had 22 teams performing very differently. We had one number telling us how we were doing. Those two things were never going to produce the right answer.

+46% Real contact cost run way above every estimate
- ₹47.4L Attendance gap surfaced in a single quarter
Flowace revealed our real contact verification cost was 28-46% higher than estimated, the visibility gap was killing margin silently.

30 – 35% Non-claim hours identified across billing teams
- 1 FTE Equivalent capacity recovered without new hires
I didn't need another consultant. I needed better data. Flowace helped us cut claim TATs and improve cash flow fast.
Frequently Asked Questions
About the Market Research and Intelligence Industry
Yes, and that’s the point for this industry. Flowace tracks analyst time at the task level and ties it to the work it produced, so cost per report, per coded unit, or per verified contact becomes a measured number rather than an estimate. One B2B data platform used this to find its real cost per verified contact was running 28–46% above the figure its pricing had always assumed.
Resolution. An org average can hold steady for months while individual teams decline underneath it. Flowace breaks the single number into per-team and per-analyst views, which is how one insights firm surfaced a 57.7-point spread between its best and worst team and ₹169L a month in idle cost that the composite had been hiding for three quarters.
By distinguishing a tool being open from a tool being used. App categorisation alone counts an open BI window or survey platform as productive; Flowace pairs that with activity signals and periodic screenshots, so background time gets separated from real work. At one platform that revealed 35% of hours logged as productive had the tool sitting idle in the background.
The intent is costing and capacity planning, not policing, and the data rolls up by team and project rather than into individual scorecards. That said, this industry uses periodic screenshots for audit accuracy, which is a more visible form of tracking than some teams expect, so be transparent with analysts about what’s captured and why. Used openly, it reads as the same rigour you apply to client data, turned inward.
The first team-level spread and idle-cost picture typically appears within the first weeks, and unit-cost findings in roughly a month, the B2B platform had its real cost-per-contact number in four weeks. From there the value compounds: pricing built on measured cost, capacity planned on real utilisation, and decline caught at the first quarter instead of the fourth.
Turn tracked time into profit
See it on your own data, free for 7 days.


Maximize Your Potential with Flowace!
Experience seamless time tracking and productivity enhancement like never before. Join the Flowace revolution and unlock your full potential. Start your journey to success today!”