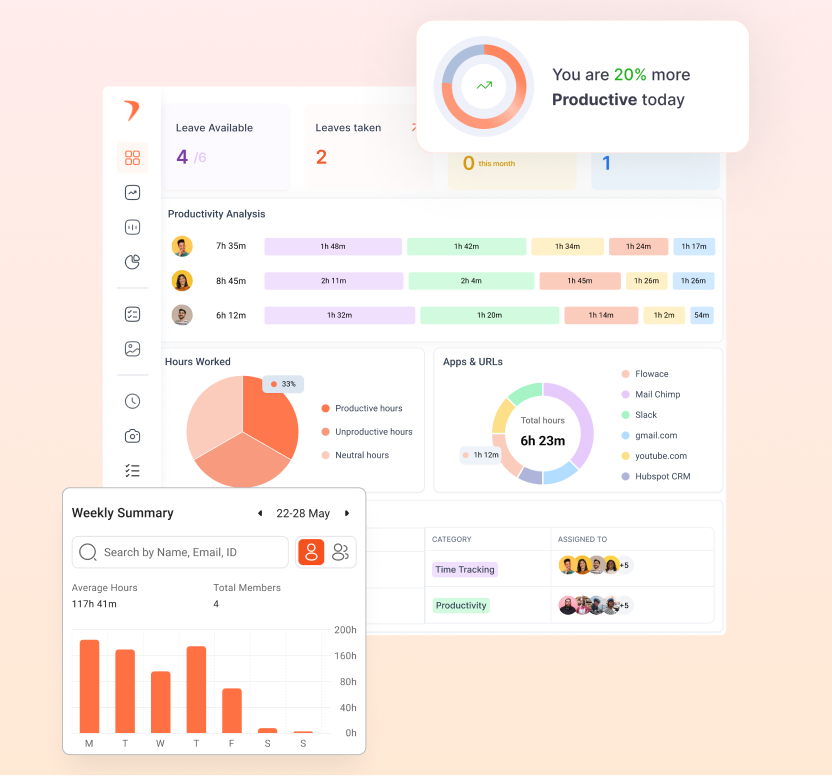
What Is Workforce Analytics? Types, Metrics & Benefits



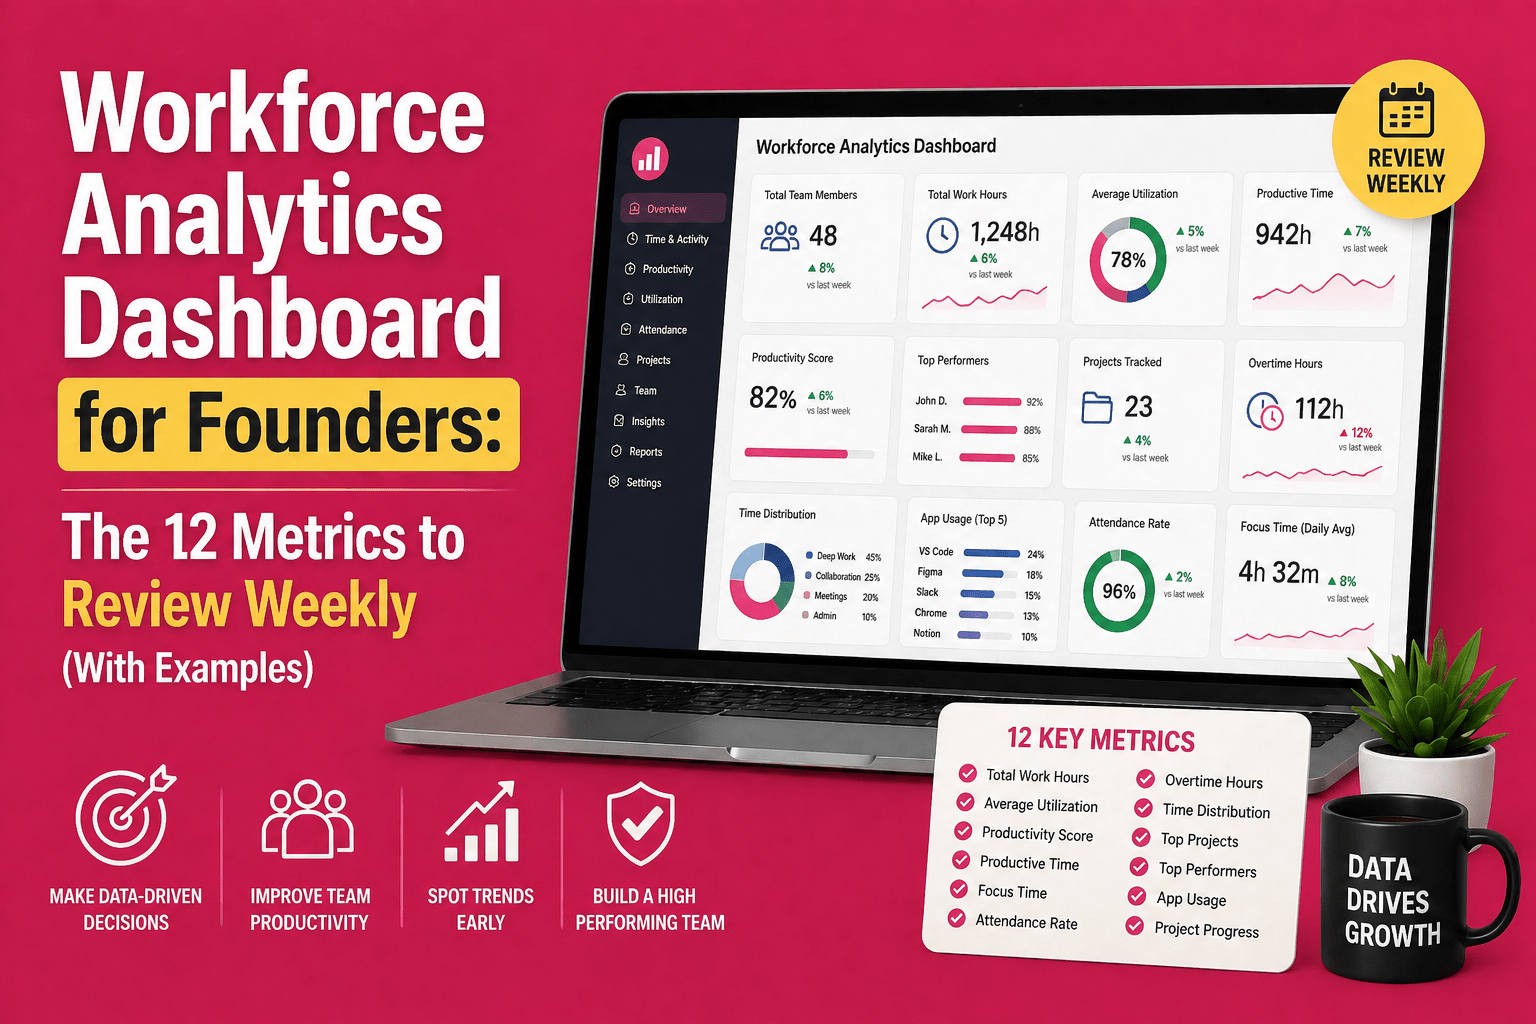
Workforce analytics is the process of collecting and analyzing employee and work data to improve staffing, productivity, and retention.
In this guide, you’ll learn what workforce analytics is, why it matters, the four types, the key metrics to track, and how to get started.
You’ll also see how workforce analytics differs from HR analytics and people analytics, terms that are often confused. The comparison table below makes the differences easy to understand.
What Workforce Analytics Means?
Workforce analytics is the process of using time, attendance, and work activity data to understand how work gets done. It helps managers make better staffing, workload, productivity, and retention decisions based on data instead of guesswork.
It shows who is overloaded, who has spare capacity, where productivity is slowing down, and where teams may be at risk of burnout. This makes it useful for HR teams, operations managers, and business leaders.
How Workforce Analytics Differs From HR Analytics and People Analytics?
Workforce analytics, HR analytics, and people analytics are related but not the same.
- Workforce analytics measures how work gets done and helps answer questions like, “Is this team’s workload balanced?”
- HR analytics measures HR processes and answers questions like, “How long does it take to hire someone?”
- People analytics looks at the full employee lifecycle and answers questions like, “Why are employees leaving?”
The comparison table below explains the differences in more detail. Most organizations start with workforce analytics because it is easier to implement and delivers faster business insights.
|
Aspect |
Workforce Analytics | HR Analytics | People Analytics |
| Primary Focus | Operational output: time, attendance, capacity, utilization | HR process efficiency: hiring, payroll, compliance |
Employee behavior and experience across the full lifecycle |
|
Data Scope |
Time tracking, attendance, activity, scheduling data | HRIS records, recruitment funnel, HR service data | HRIS plus surveys, performance reviews, and sentiment data |
| Time Orientation | Real time and near term, often day to day or week to week | Operational, monthly or quarterly cycles |
Longer term, often quarterly to annual |
|
Typical Owner |
Operations heads, team managers, HR ops | HR operations and HRIS administrators | People analytics or HR strategy teams |
| Example Use Case | Spotting a team that is overloaded this week based on tracked hours | Measuring time to hire or cost per hire |
Predicting flight risk from engagement survey trends |
What Data Workforce Analytics Uses?
Workforce analytics uses data that companies already collect every day. The most common data sources include:
- HRIS records for employee, department, and role information
- Attendance and shift data, including clock-in and clock-out times
- Time tracking and work activity data from business apps and tools
- Employee engagement or pulse survey results
A workforce intelligence platform brings this data into one dashboard, making it easier to track trends and make better staffing, productivity, and retention decisions.
Why Workforce Analytics Matters for Modern Teams?
Workforce analytics helps managers make better decisions using real employee and work data. It helps teams improve staffing, productivity, retention, and workload planning by spotting risks early.
For remote and hybrid teams, workforce analytics provides clear visibility into workload, capacity, and employee work patterns.
1. Spot Workforce Risks Early
Workforce analytics helps identify early signs of burnout, disengagement, and workload issues. For example, rising overtime, longer work hours, or lower focus time can show that a team may be under pressure.
2. Plan Staffing and Capacity Better
Workforce analytics shows how much capacity each team has and how work is distributed. Managers can use utilization and workload data to plan hiring, shift work, or redistribute tasks before employees feel overloaded.
3. Reduce Burnout and Employee Turnover
Workforce analytics tracks patterns like overtime, attendance, and work activity to identify employee burnout risks early. This helps managers support employees before workload issues lead to disengagement or resignations.
4. Connect Workforce Data to Business Results
Workforce analytics connects employee data with business outcomes like productivity, utilization, and project performance. It helps leaders move from simply tracking hours worked to understanding how time is being used and where improvements can be made.
Knowcraft found a smarter way to manage team capacity.
See HowWhat Are The Types of Workforce Analytics?
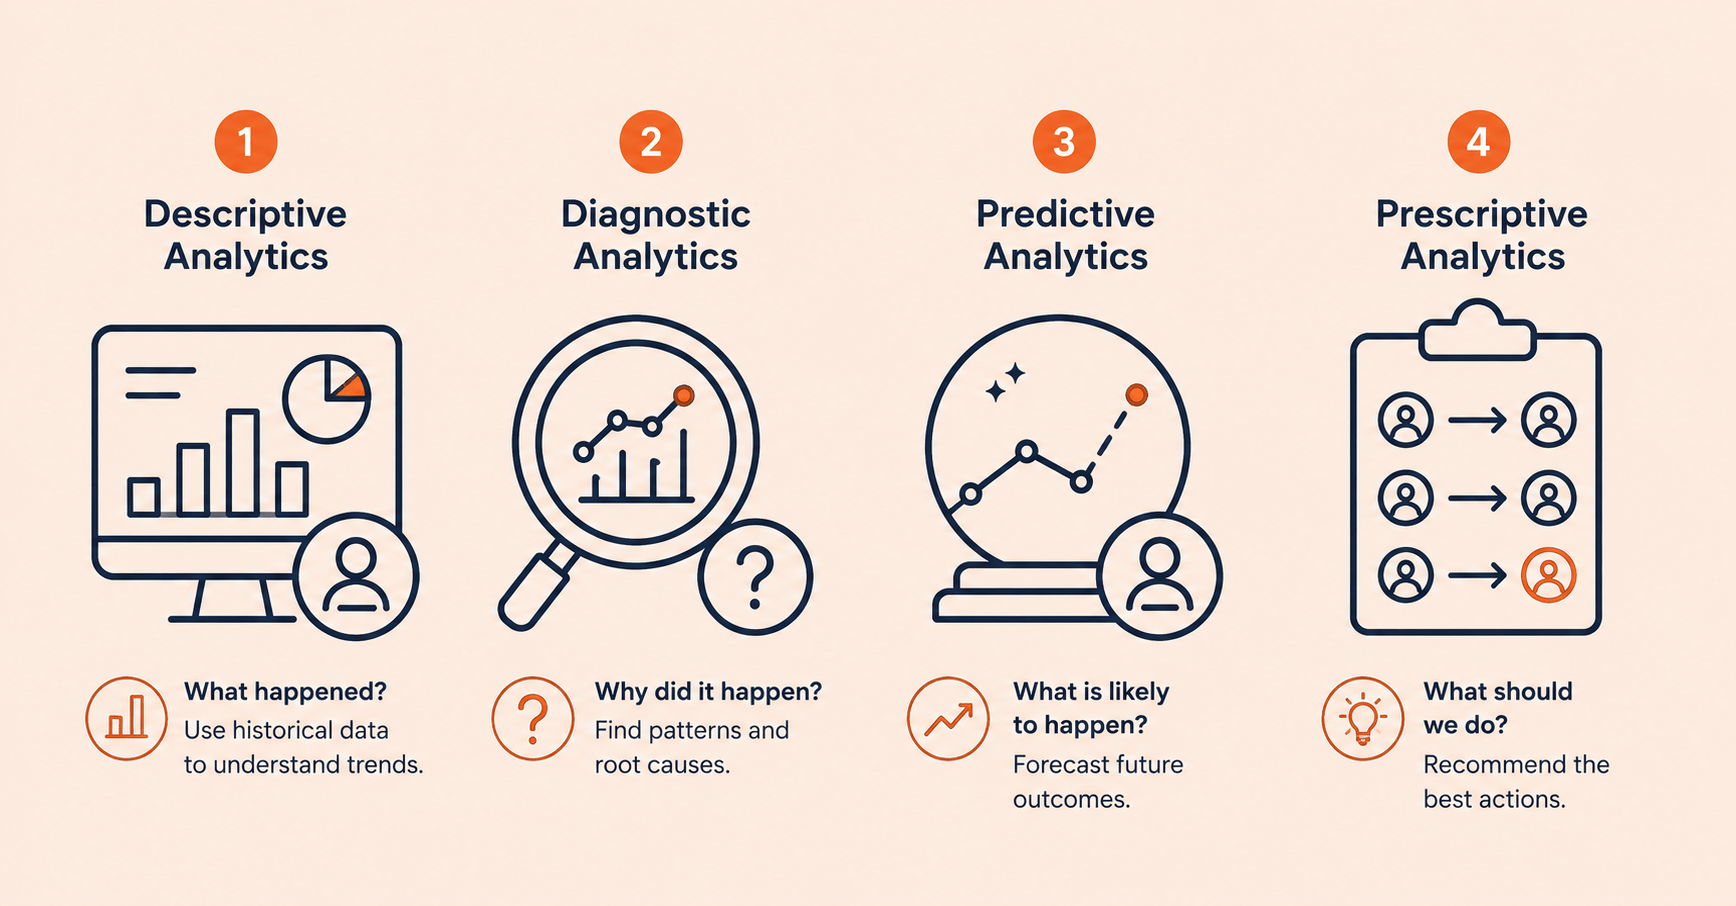
There are four types of workforce analytics. Descriptive, diagnostic, predictive, and prescriptive. Each type builds on the last, from understanding the past to improving future decisions.
1. Descriptive Analytics
Descriptive analytics explains what happened by using historical data and dashboards. It helps teams track past activity and understand current workforce trends.
Example: A weekly report showing total hours logged by each team, without predicting future outcomes.
Most companies begin with descriptive analytics because it is the easiest type to implement.
2. Diagnostic Analytics
Diagnostic analytics explains why something happened by finding patterns and causes behind the data.
Example: A team’s utilization drops 15% in a month due to a rise in unplanned meetings.
This helps managers understand problems instead of only seeing the results.
3. Predictive Analytics
Predictive analytics uses past data and patterns to forecast what is likely to happen next.
Example: Identifying employees at higher risk of leaving based on lower engagement, rising overtime, or changing work patterns.
Predictive workforce analytics helps managers take action before problems become bigger.
4. Prescriptive Analytics
Prescriptive analytics recommends what action to take next based on available data.
Example: A system suggests moving accounts from overloaded employees to teammates with available capacity.
Very few organizations use prescriptive analytics consistently today because it requires high-quality data and advanced analytics capabilities.
Key Workforce Analytics Metrics To Track
The four key workforce analytics metrics teams should track are utilization, attendance, turnover, and engagement. Each metric uses a simple formula that teams can calculate without advanced data skills.
1. Productivity and Utilization Metrics
Utilization rate measures how much of an employee’s available work time is spent on productive, billable, or planned tasks.
Formula:
Utilization Rate = (Hours spent on productive work ÷ Total available hours) × 100
A workforce analytics dashboard that tracks this daily helps a founder or ops head catch a capacity problem in week one instead of quarter three.
2. Attendance and Absenteeism Metrics
Absenteeism rate measures how often employees miss scheduled work. A rising absenteeism trend can be an early sign of workload issues or burnout risk.
Formula:
Absenteeism Rate = (Days absent ÷ Total scheduled workdays) × 100
For BPO and shift-based teams, absenteeism data helps with shift planning and staffing.
3. Turnover and Retention Metrics
Turnover rate shows the percentage of employees who leave an organization during a specific period. It is one of the most commonly tracked workforce analytics metrics.
Formula:
Turnover Rate = (Employees who left ÷ Average headcount) × 100
Tracking turnover by team or manager reveals retention issues better than company-wide numbers
4. Engagement Metrics
Engagement metrics measure how connected employees feel to their work. Common examples include employee Net Promoter Score (eNPS) and short employee pulse surveys.
Unlike other metrics, engagement data comes from employees so both the score and response rate matter.
Benefits and Challenges of Workforce Analytics
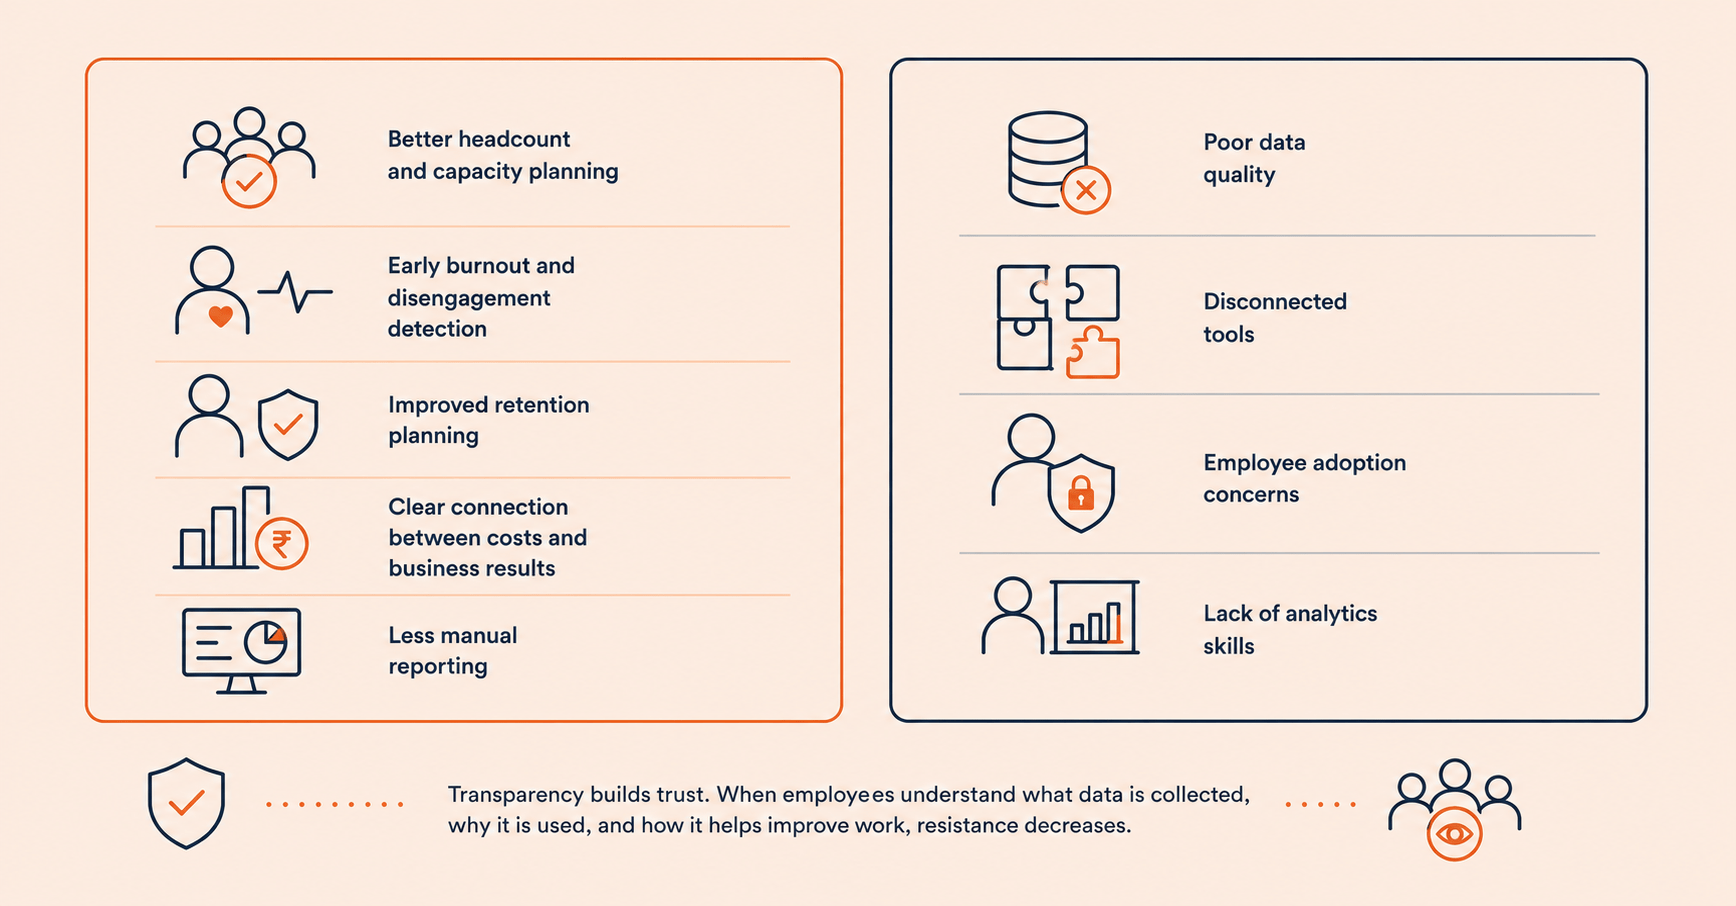
Workforce analytics helps companies make better decisions using real workforce data. It improves planning, productivity, and retention but also comes with data and adoption challenges.
Key Benefits of Workforce Analytics
- Better headcount and capacity planning: Workforce analytics helps managers make faster decisions based on real workload and capacity data instead of assumptions.
- Early burnout and disengagement detection: Tracking work patterns can help identify risks like rising overtime, workload imbalance, and declining engagement.
- Improved retention planning: Workforce analytics can reveal early warning signs of employee turnover, giving teams time to take action.
- Clear connection between workforce costs and business results: Teams can understand how employee time and effort contribute to business outcomes.
- Less manual reporting: Automated dashboards reduce the need for spreadsheets and manual timesheet tracking.
Common Challenges of Workforce Analytics
- Poor data quality: Data spread across HRIS, attendance systems, and project tools can make analysis difficult.
- Disconnected tools: When different systems store separate parts of workforce data, teams may struggle to get a complete view.
- Employee adoption concerns: Some employees may worry about how their data is collected and used.
- Lack of analytics skills: Teams may need training to understand data and turn insights into action.
The biggest factor in successful adoption is transparency. When employees understand what data is collected, why it is used, and how it helps improve work, resistance decreases. Workforce analytics works best when managers and employees have shared visibility into the same information.
How To Get Started With Workforce Analytics
Getting started with workforce analytics involves five simple steps. The goal is to start small, use reliable data, and turn workforce insights into better decisions.
1. Define Your Business Goal
Start by deciding what you want to improve. Common goals include capacity planning, employee retention, productivity, or cost control.
2. Audit Your Existing Data
Review the data your current systems already collect, including HRIS records, attendance data, and project management tools. Identify gaps before choosing a platform.
3. Choose a Platform That Connects Your Data
Select a workforce analytics platform that brings different data sources into one dashboard. This avoids manually combining reports from multiple systems.
4. Start With a Small Pilot
Run a pilot with one team before expanding across the company. A smaller test makes it easier to find data issues and improve the process.
5. Review Insights and Take Action
Check your workforce dashboard regularly and use the insights to make decisions. Data only creates value when teams use it to solve real problems.
For a deeper look at the data collection process, this guide on how to conduct workforce analysis explains how to audit and organize workforce data.
A CA firm's journey from manual tracking to smarter workforce decisions.
Read Full Case StudyHow Flowace Helps Teams Use Workforce Analytics?
Flowace helps teams apply workforce analytics by bringing time tracking, attendance, and utilization data into one dashboard. This gives managers a clearer view of work patterns without relying on manual timesheets.
According to Flowace’s own product data, many teams identify their first workflow inefficiency within 72 hours of setup. This can help managers quickly find areas where workloads, processes, or time usage can be improved.
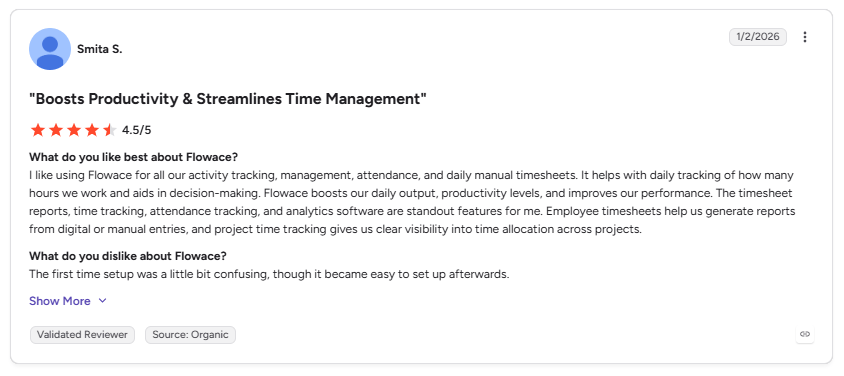
Flowace has a 4.6 out of 5 rating from 137 reviews on G2 as of mid-2026. Users often mention that automated attendance tracking and work pattern visibility make it easier to manage distributed and hybrid teams.
Like any workforce analytics tool, Flowace has limitations. Some G2 reviewers mention that setup can be confusing and large reports may load slowly.
For the latest plans and pricing details, check their workforce analytics software page.
Frequently Asked Questions About Workforce Analytics
1. What is workforce analytics in simple terms?
Workforce analytics uses employee and work data, such as time, attendance, and activity data, to understand how work happens. It helps managers make better decisions about staffing, workload, productivity, and retention.
2. What is the difference between workforce analytics and HR analytics?
Workforce analytics focuses on daily work patterns using data like time, attendance, and utilization. HR analytics focuses on HR processes like hiring, payroll, and compliance. Both can support broader people analytics.
3. What are the four pillars of workforce management?
The four pillars of workforce management are demand forecasting, scheduling and staffing, time and attendance tracking, and performance monitoring. Workforce analytics provides the data needed to improve each area.
4. What are the four types of workforce analytics?
The four types of workforce analytics are descriptive, diagnostic, predictive, and prescriptive analytics. They help organizations move from understanding past workforce trends to predicting future outcomes and deciding the best actions to take. Most organizations currently use descriptive and diagnostic analytics because they are easier to implement.
5. What metrics should you track in workforce analytics?
The key workforce analytics metrics include utilization rate, absenteeism rate, turnover rate, and employee engagement scores. These metrics use data companies already collect through HRIS, attendance, and time tracking systems.
6. What are examples of workforce analytics?
Examples include finding overloaded teams and identifying rising absenteeism trends. It can also predict turnover risks and help plan staffing using utilization data.
7. How do you get started with workforce analytics?
Start by defining your business goal and reviewing existing data sources. Then choose a platform, test it with a small team, and expand based on insights.
8. What are the benefits of workforce analytics?
Workforce analytics improves capacity planning and helps identify burnout and turnover risks early. It also reduces manual reporting and connects workforce costs with business results.