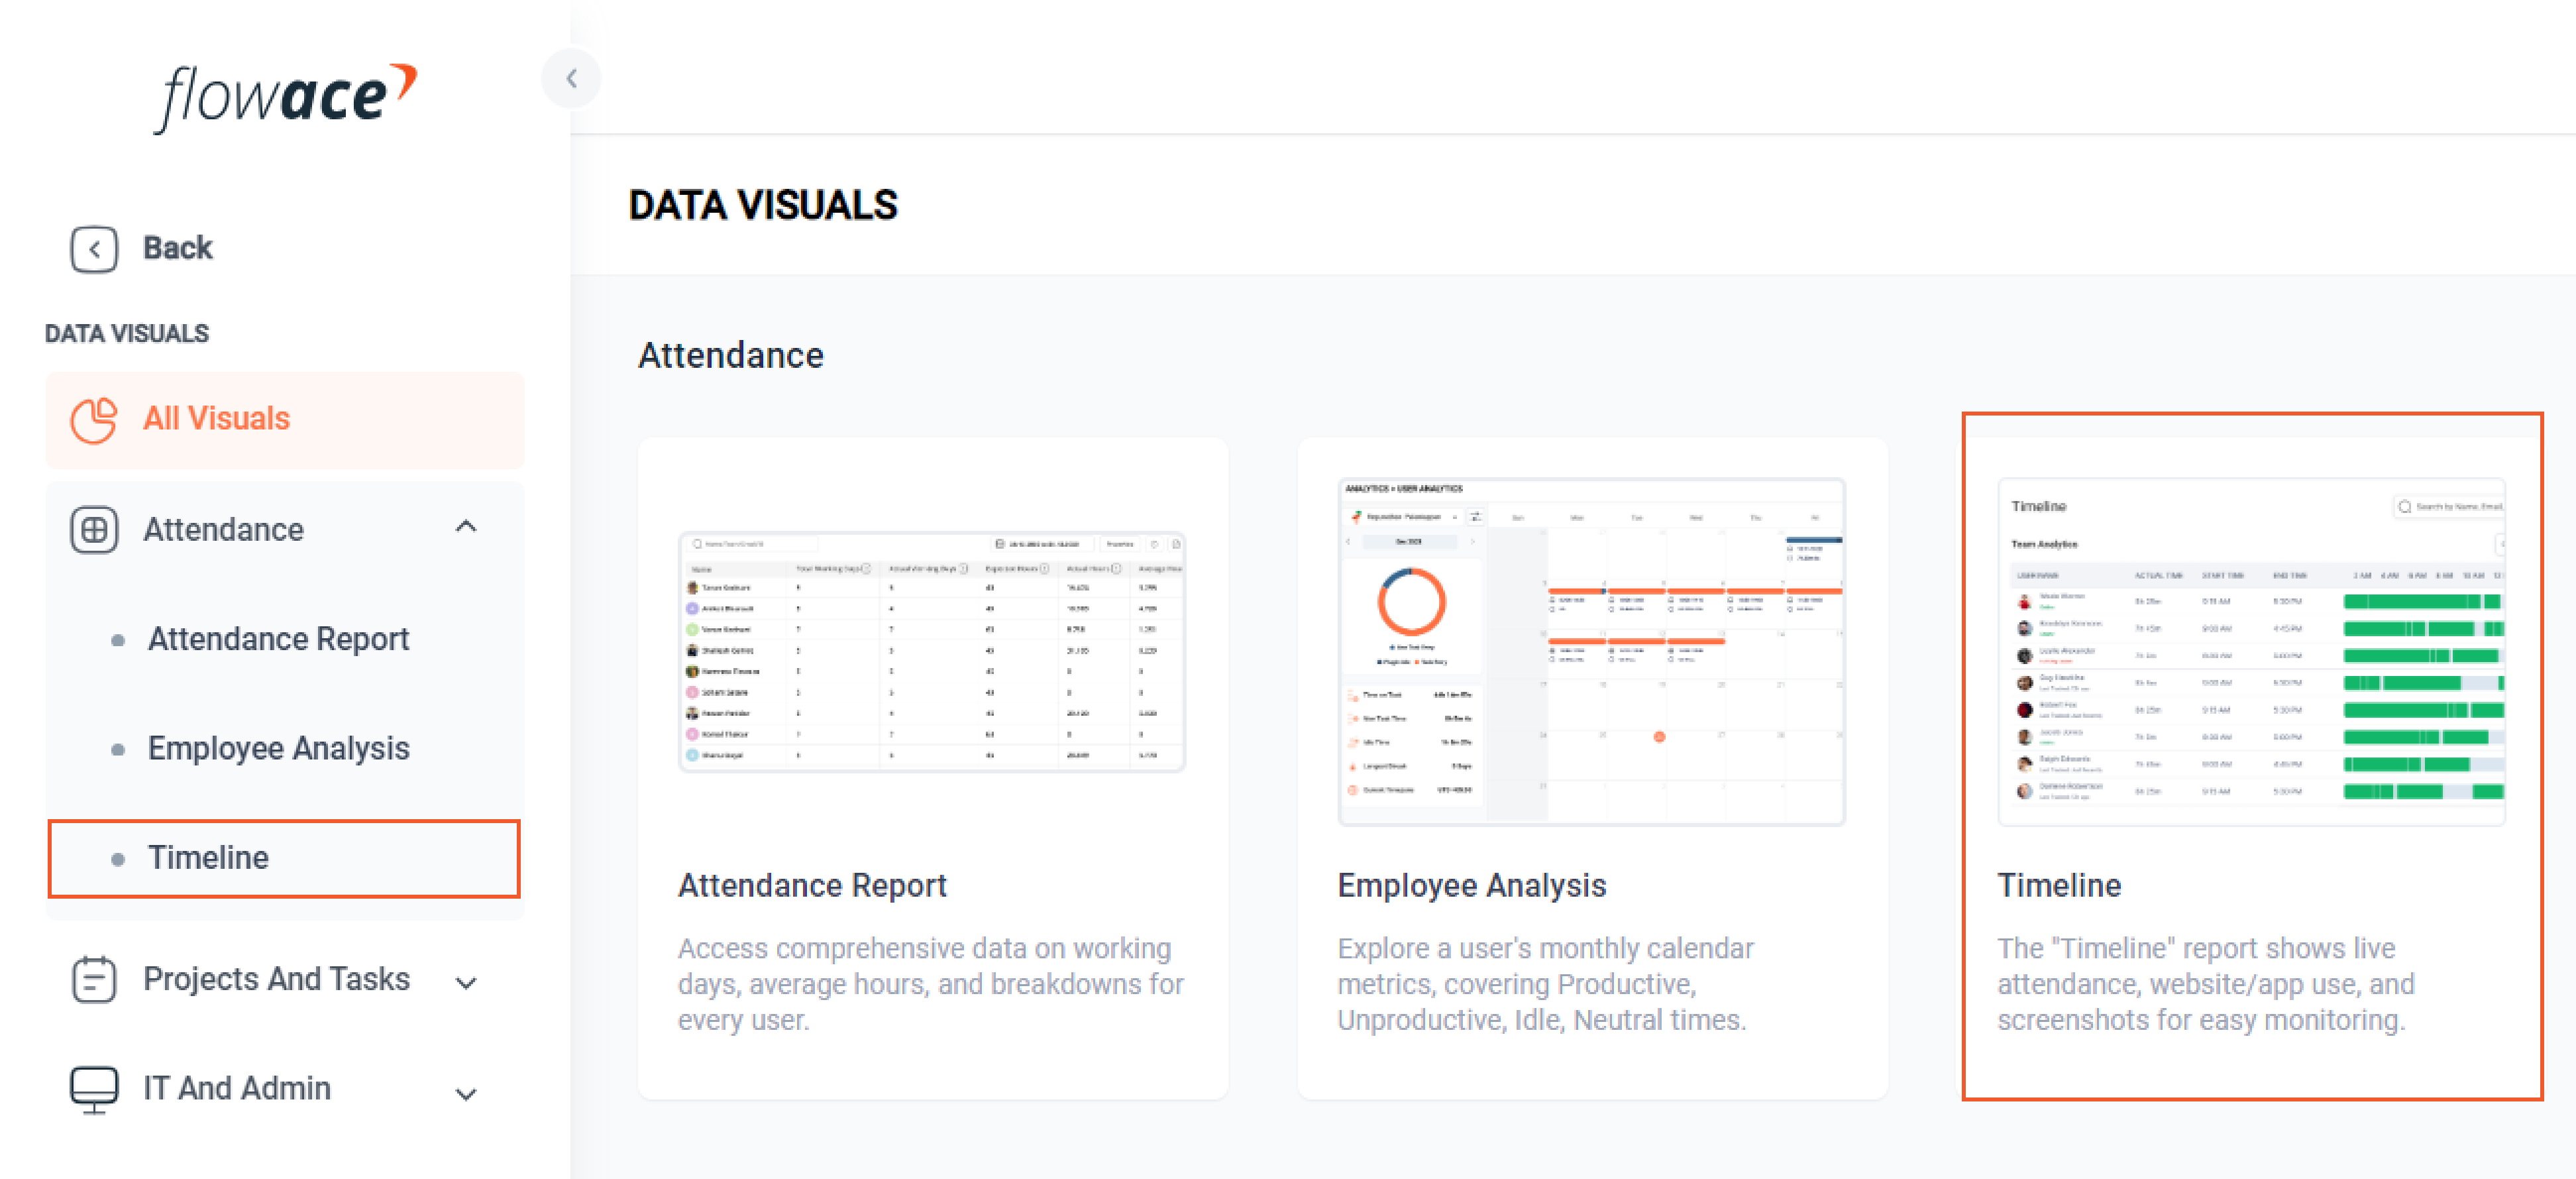
The Timeline feature in Flowace gives you a clear view of your team’s daily activities, showing real-time data on when employees are working and how long they’ve been active. Here’s how to easily access and use the Timeline feature.
Step 1: Accessing the Timeline Feature
In the left-hand menu, go to the Data Visuals section.
Click on the Attendance dropdown and select Timeline.
Step 2: Viewing Employee Activity
Once you’re in the Timeline section, you’ll see a list of all employees. For each team member, you’ll find:
Employee Name: This shows the employee’s name, and you’ll see tags like “full day leave,” “half day leave,” “weekly off,” or “holiday” next to their name, depending on their status.
Actual Time: This shows how long the employee has been active during the day.
Start Time and End Time: The times when the employee started and finished work for the day.
Green Dot: Indicates the employee is currently active and working.
Grey Dot: Shows that the employee is offline.
Step 3: Understanding the Timeline Graph
The Timeline uses a 48-hour format, making it easy to track employees working night shifts. The graph includes:
Green Bars: These show when the employee was actively working.
Grey Bars: Indicate times when the employee was idle or not working.
You can also see the last time each employee was tracked, giving you real-time information about their status.