Key Takeaways:
- Agency utilization rate measures profitability efficiency. It shows the percentage of available hours spent on billable, revenue-generating work.
- The core formula is simple: (Billable Hours ÷ Total Available Hours) × 100 — but accuracy depends on reliable time tracking.
- A healthy benchmark is typically 70–80%. This range balances strong revenue performance with sustainable workloads.
- Track both resource utilization and billable utilization. Resource utilization shows overall workload; billable utilization directly impacts revenue.
- Consistent monitoring reveals capacity gaps. Low utilization may signal underused staff or excess admin work, while overly high rates risk burnout.
- Spreadsheets work—but don’t scale well. Manual tracking often leads to missed entries, rounding errors, and delayed insights.
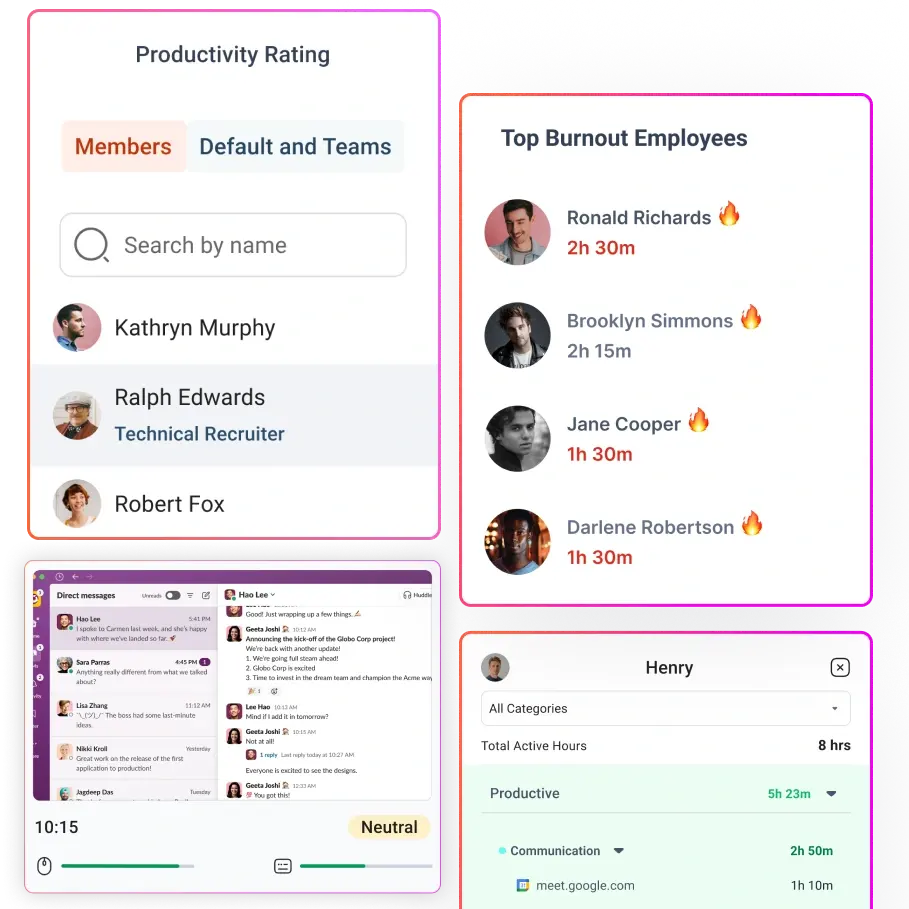
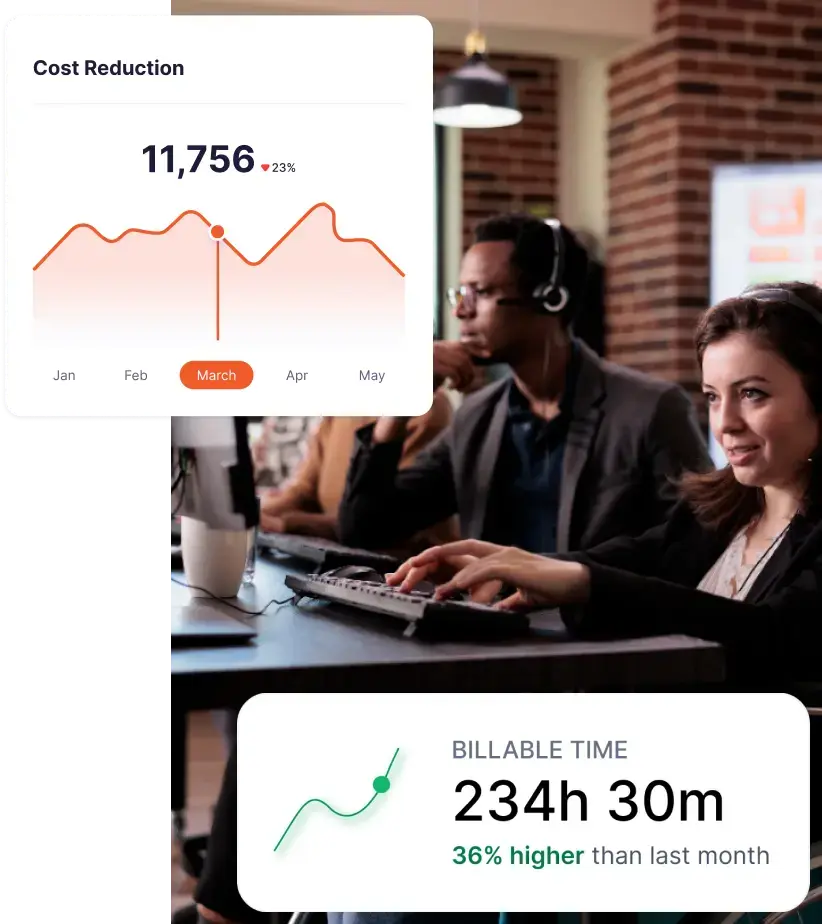
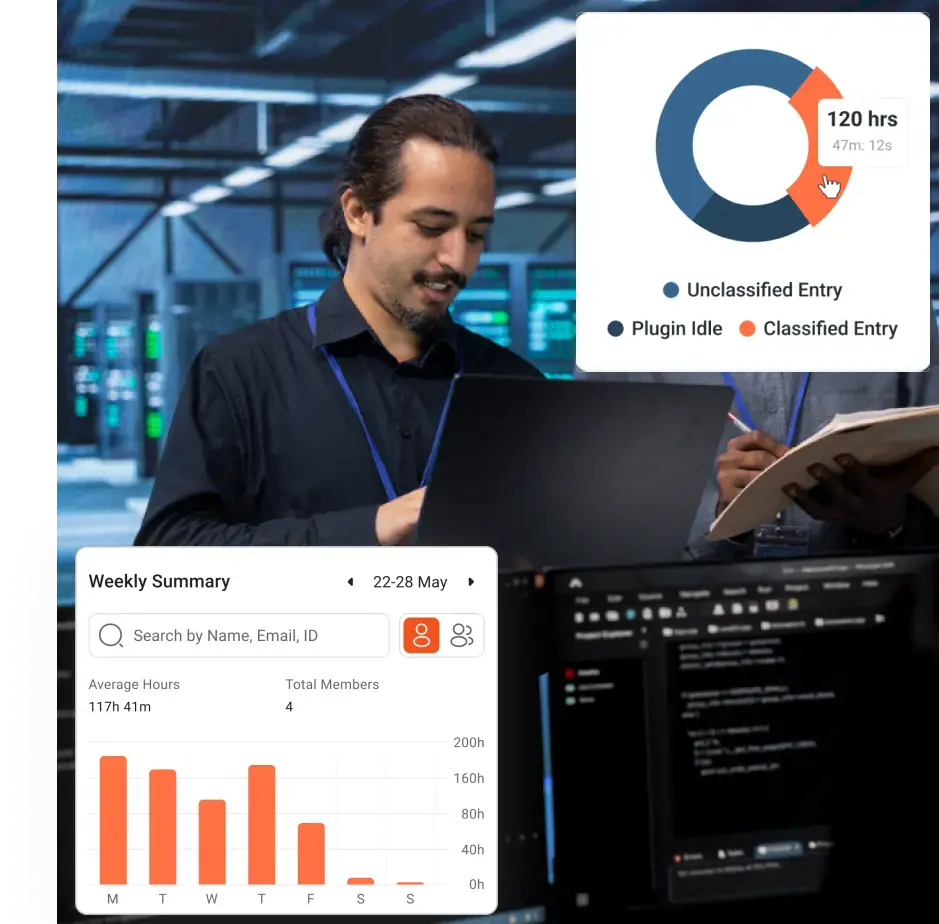
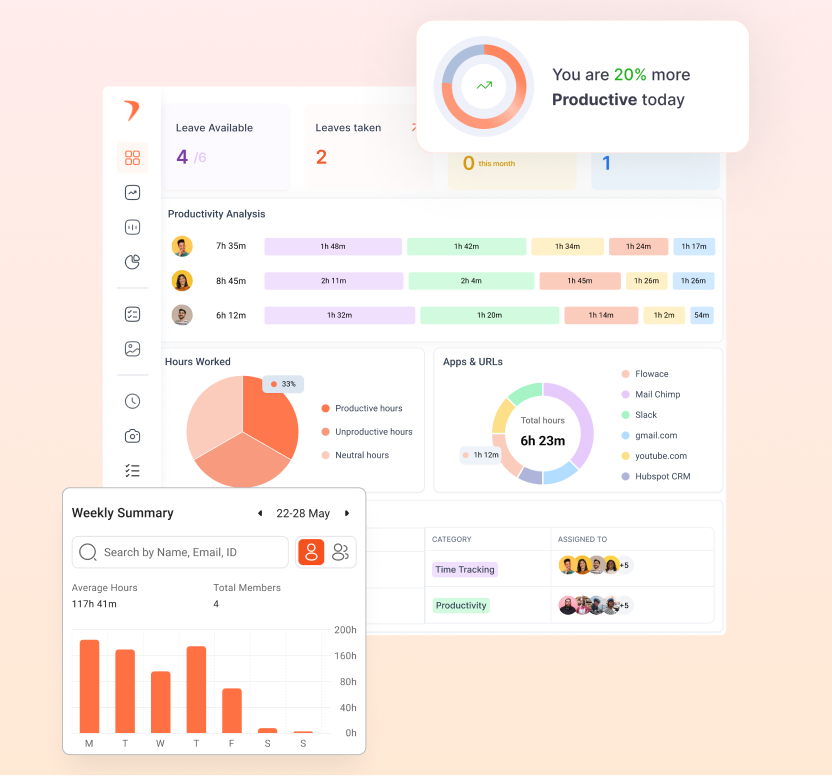
- Automated tracking improves accuracy and visibility. Tools like Flowace provide real-time dashboards, auto-classification of work, and reduced admin effort.
- Avoid common mistakes. Account for PTO and part-time capacity, classify billable vs. non-billable work correctly, and don’t chase unrealistic 100% utilization.
- Use templates to simplify monthly tracking. A structured utilization calculator makes it easier to monitor trends and compare teams.
- Act on the data. Rebalance workloads, adjust hiring plans, refine client scope, or improve processes based on utilization trends—not assumptions.
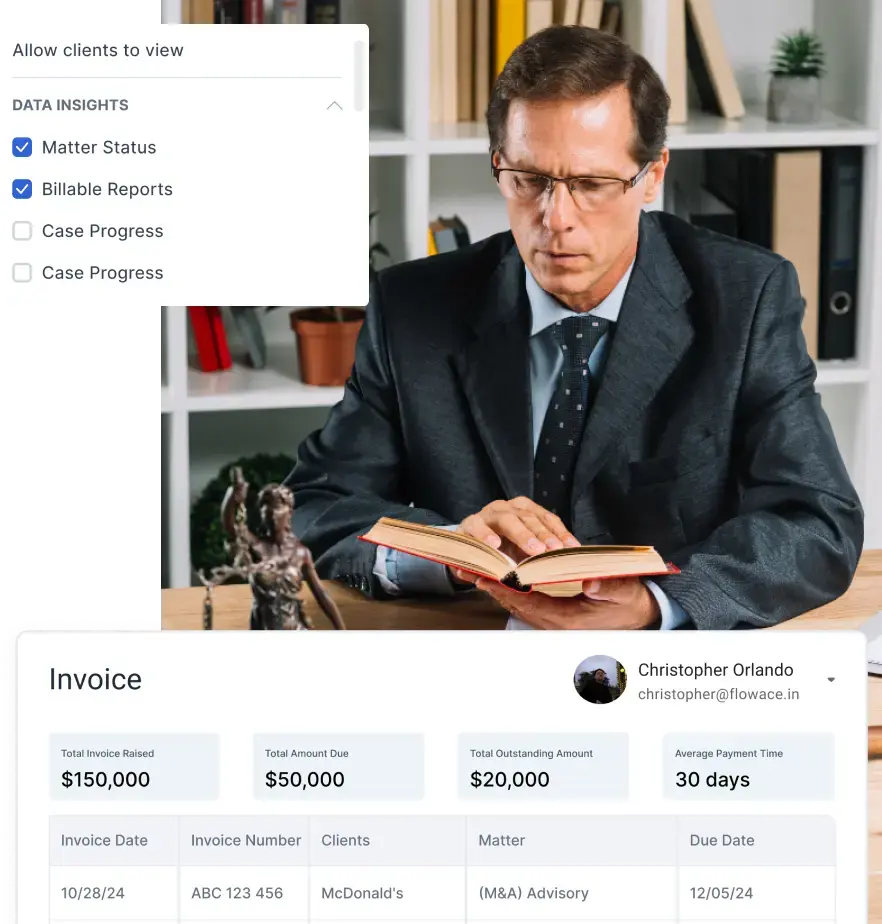
- Protect trust while tracking. Align utilization monitoring with employee monitoring data protection principles to ensure transparency and ethical governance.
- Automation reduces overhead and increases insight. Modern systems can replace manual timesheets with accurate, real-time utilization reporting.
Tracking your agency’s utilization rate helps ensure you bill enough hours to stay profitable. Agency utilization rate measures the percentage of a team’s total available hours that are spent on billable work.
For example, if you have a 40-hour work week and bill 30 of those hours to clients, your utilization rate is (30/40)×100 = 75%. This simple formula is the backbone of agency utilization calculators, showing how efficiently your team’s time is being used.
Industry guides explain that aiming for about 70–80% utilization is healthy: it means most hours go to clients, with room left for necessary non-billable tasks. Staying in this range maximizes revenue without burning out your people.
Keeping these targets in mind, let’s break down how to calculate utilization, avoid common mistakes, and use modern employee monitoring tools to automate tracking.
Why Agency Utilization Rate Matters

Efficient utilization is crucial for agency profitability and resource planning. A high agency utilization rate means more hours billed to clients, which drives revenue. It also reveals capacity gaps. For example, consistently low rates might signal underutilized staff or excessive non-billable work.
Conversely, pushing people to 100% billable time can backfire. By tracking agency rate utilization, you get data-driven insights into workloads and employee productivity, helping with hiring and shift assignments before project deadlines slip. Accurate utilization tracking supports fair workload distribution and shows which teams or projects need attention, contributing to smarter project management and satisfied clients.
Understanding Billable vs. Non-Billable Time
If you want a clear view of agency profitability, don’t rely on surface-level metrics or isolated KPIs. Remember that “Utilization” always comes in two flavors: resource utilization (all work) and billable utilization (revenue work).
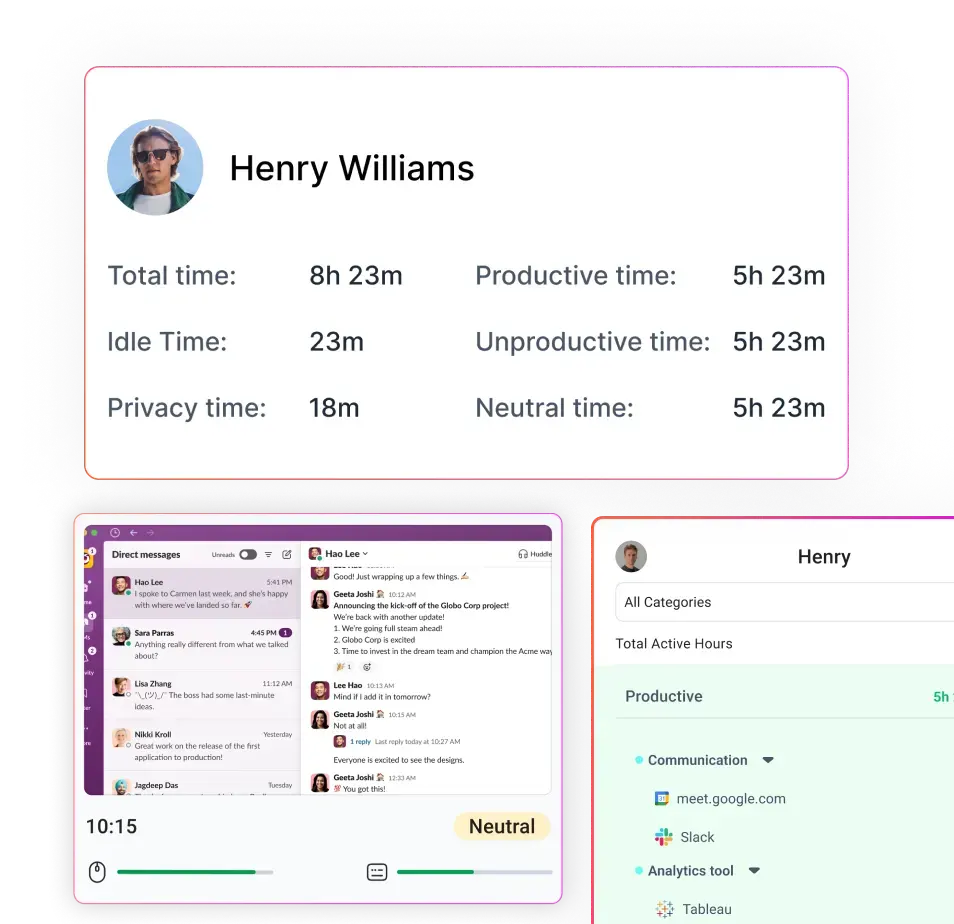
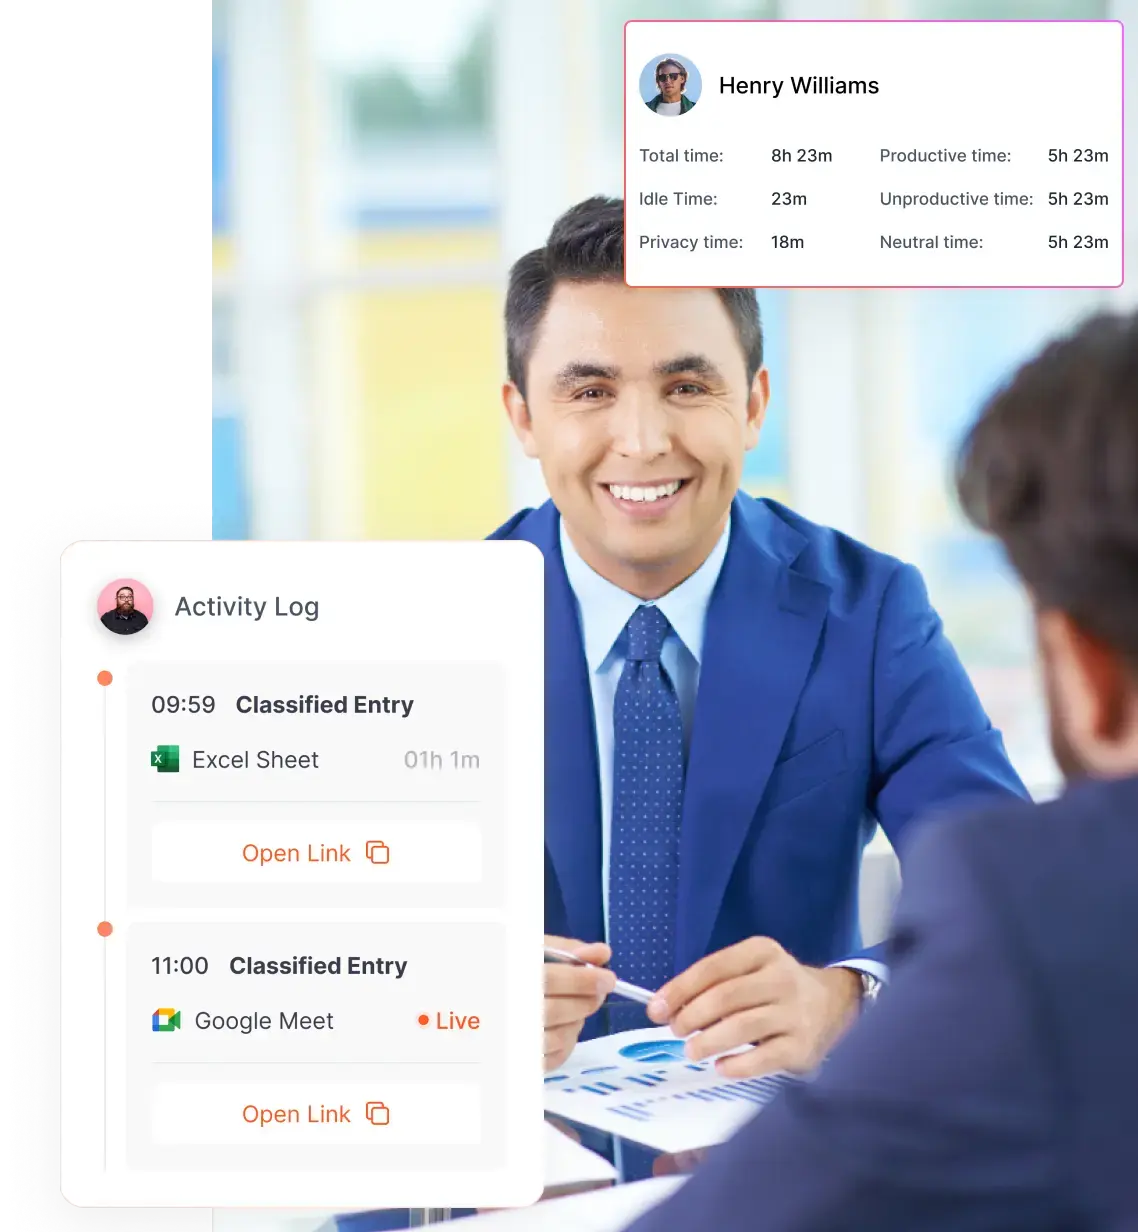
Resource utilization measures the percentage of available hours spent on any work (including internal meetings, training, or admin tasks), whereas billable utilization measures only the time spent on client-approved, revenue-generating tasks. Both numbers are important. Tracking both metrics lets you see if you’re spending enough time on client work. Agencies often track billable utilization closely, since it directly affects revenue.
Project reports should clearly tag hours as billable or not. In a consulting context, an average billable utilization might be in the high 60%’s, while a bustling creative studio might target the high 70%’s. Understanding the difference prevents misinterpretation.
A 60% utilization rate could be great if it includes training and business development, but it could indicate inefficiency if most time wasn’t billable.
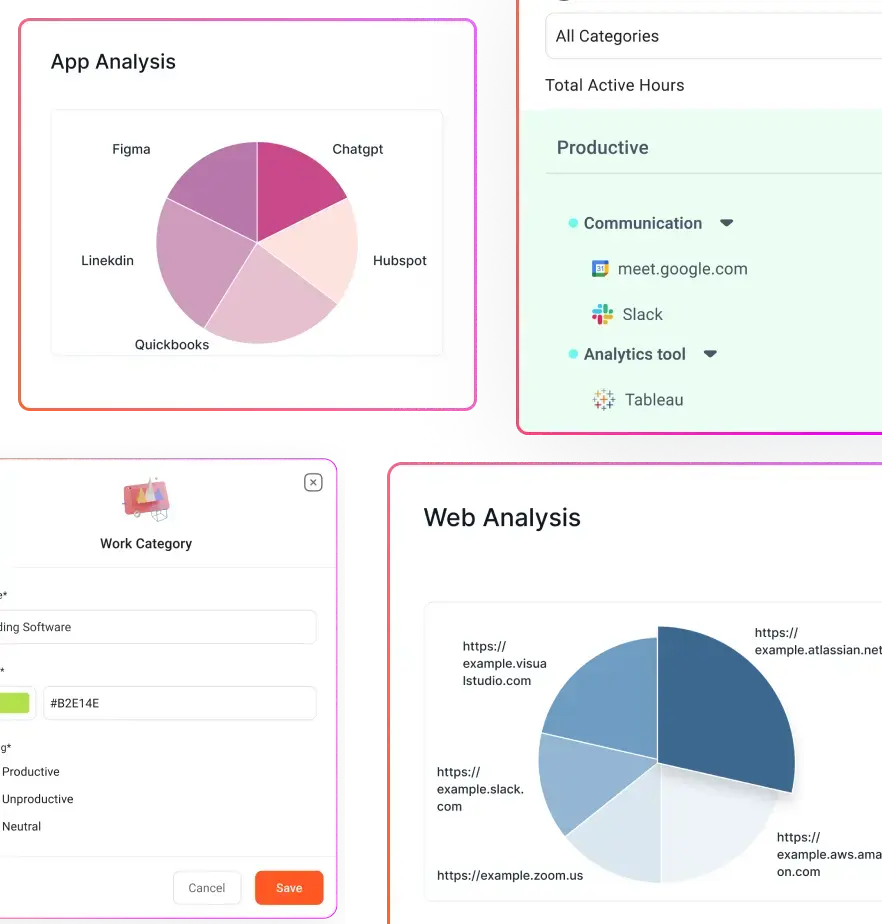
A well-built Agency Utilization Rate Calculator separates these two clearly so you don’t confuse busy work with revenue work.
Tools that automate time classification, like Flowace’s AI tracker, can help by automatically distinguishing client work from internal tasks, so you get accurate billable vs non-billable breakdowns.
How to Calculate Your Agency’s Utilization Rate
Calculating utilization is simple:
Utilization Rate = (Billable Hours / Total Available Hours) × 100%
First, sum up all the billable hours your team logged during the selected period. Then calculate the total hours worked in that same timeframe, including both billable and non-billable time.
Once you have those two numbers, plug them into the formula, and you’ll have your answer.
For example, consider an IT agency with 3 developers (40h capacity each) who logged 95 billable hours out of 120 total hours last week.
The team’s utilization is (95/120)×100 = 79%.
Apps or spreadsheets can automate this math. For a hands-on view, you can download a free Excel or Google Sheets template. These templates usually include cells for available hours, worked hours, and billable hours, with formulas that compute resource and billable utilization. Simply enter your team’s data, and the sheet will highlight utilization percentages and even flag gaps.
Here’s a quick example: a team of four with 160 total available hours each month, who worked a combined 159 hours, 121 of which were billable, would show 99% resource utilization and 76% billable utilization.
These numbers help you understand where your effort is going. If you see under 70%, you may have internal tasks or idle time eating into billable work. Most agencies try to keep utilization around the industry norm (around 70–80%) while ensuring everyone has reasonable breaks. Monitoring these rates regularly lets you spot trends (e.g., if utilization drops after a campaign launch) and adjust staffing before it hurts profits.
Free Agency Utilization Rate Calculator Template
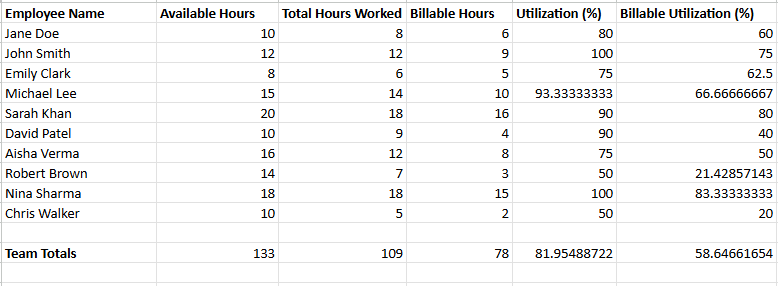
To simplify the calculation, use a ready-made Excel template for agency utilization. These templates often have columns for “Available Capacity,” “Total Hours Tracked,” and “Total Billable Hours,” then show resource and billable utilization with a click or two (much like the Bonsai calculator interface.
If building your own, start with rows for each employee or team, list hours available (e.g., 160/month) and hours worked, and use an Excel formula like =SUM(billable_hours)/SUM(total_hours)*100.
Color-coded cells can make it easy to see who is under- or over-utilized. Keep in mind to account for holidays and days off in the available hours so you’re not skewing rates.
Download the free template here.
Whether you use a template or build from scratch, having a downloadable utilization calculator at hand ensures you can quickly plug in numbers each month and get instant insights into your agency’s productivity.
Manual vs Automated Utilization Tracking: A Comparison
Manual tracking typically relies on employees entering their hours into spreadsheets or basic logs, with managers consolidating and calculating totals at the end of the week or month. This approach depends heavily on memory, consistency, and careful data entry. Small rounding habits, delayed entries, or missing non-billable time can quietly distort utilization rates. As teams grow, the administrative burden increases, and spreadsheets become harder to manage, audit, and scale.
Automated utilization tracking, by contrast, captures time data directly through dedicated systems. Work hours, project allocation, and in some cases application usage are logged continuously and fed into dashboards that calculate utilization in real time.
| Aspect | Manual Tracking | Automated Tracking (e.g. Flowace) |
| Data Entry | Relies on employees to log hours via timers or spreadsheets. Prone to missed entries. | Captures work time automatically (apps, websites, idle time) without start/stop timers. |
| Accuracy | Often inaccurate – people forget to track small tasks or round hours. | Highly accurate – uses screenshots, app logs, and auto-detection to record real activity. |
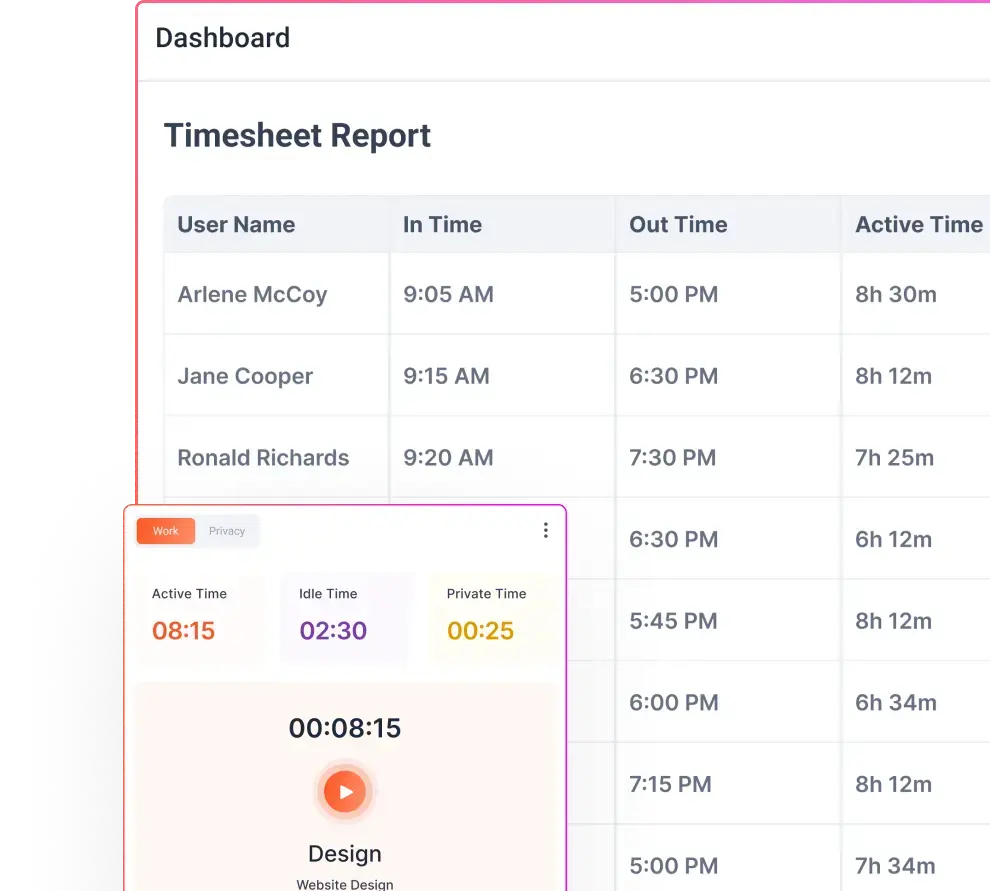
| Time Spent | Time-consuming for staff to fill timesheets and for admins to consolidate. | Zero manual timesheet filling – reports and timesheets are auto-generated. |
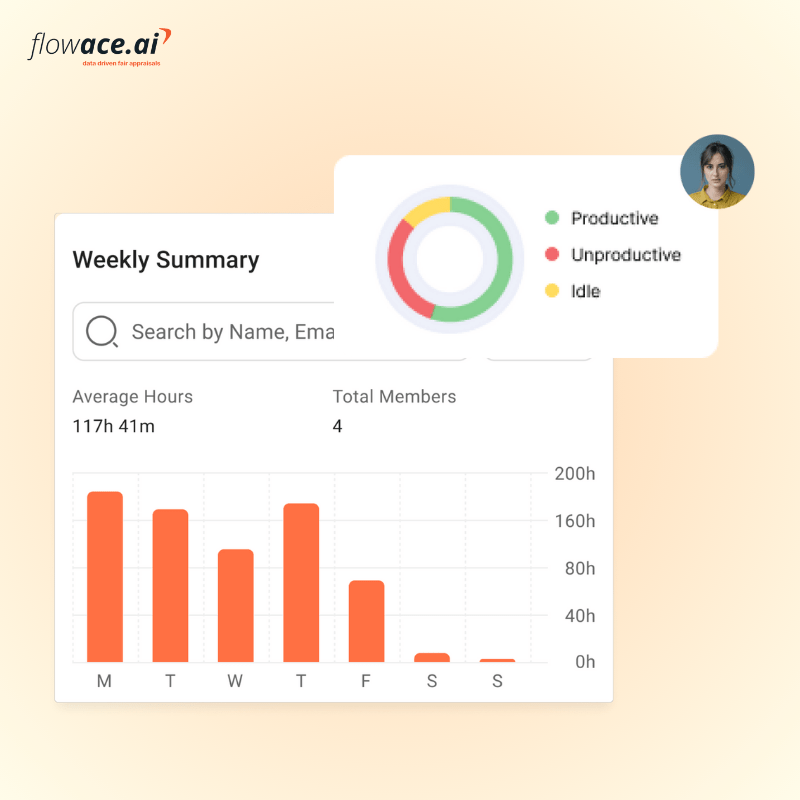
| Insights | Delayed insights (reporting weekly or monthly) with limited analytics. | Real-time dashboards and analytics (productivity insights, project vs. admin time). |
| Flexibility | Hard to account for corrections (idle time, travel, manual overrides). | Allows manual edits but auto-detects idle/active time and syncs with calendars. |
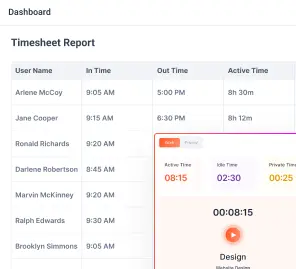
Automated tools like Flowace turn time tracking from a chore into a background service. Flowace’s AI engine automatically classifies tasks and records attendance, so managers see a real-time breakdown of billable vs. non-billable time.
This hands-free approach avoids “spreadsheet chaos” and ensures timesheets are accurate and auditable. For example, Flowace can auto-start tracking at login, monitor apps and software usage, and even log breaks – eliminating the admin work of managing timesheets.
One common mistake is to chase 100% utilization by forcing staff to log every minute; this often leads to fudged timesheets or burnout. Automated tracking solves this with idle-detection and privacy controls. It flags when someone is idle or on a break, prompting gentle reminders without constant oversight.
In short, an automated system reduces errors and frees up time for higher-value work, while giving you much more reliable data on who is truly busy or idle.
Common Mistakes in Utilization Rate Tracking (and How to Avoid Them)
Several pitfalls can skew your utilization data. One big mistake is relying on outdated tools. Sticking with static spreadsheets or generic trackers often leads to errors and time wasted merging data.
Another error is ignoring part-time capacity or PTO: if you assume everyone is available 40h/week without accounting for vacations or sick days, you’ll overestimate capacity and under-report utilization.
Agencies also sometimes misclassify internal tasks. For example, if admin or training is accidentally tagged as billable, utilization seems higher but profit takes a hit. Maintain clear rules on what counts as billable (client meetings, project work) vs. overhead (staff meetings, proposal writing).
Checklist: Steps to Calculate and Improve Utilization
- Gather each team member’s total available hours and recorded work hours for the period.
- Use the formula (Billable Hours ÷ Available Hours) × 100 to compute utilization.
- Compare against benchmarks (aim ~70–80%) to see if you’re on target.
- Investigate low-utilization causes (idle time, admin tasks, or resource shortages).
- Increase billable efficiency by reducing non-essential work or hiring as needed.
- Repeat monthly and adjust targets; use visual dashboards for ongoing visibility.
Conclusion
When you track agency utilization rate properly, you stop guessing and start deciding with clarity. Once you measure how much of your team’s available time is truly billable, you get a clean read on capacity, profitability, and where to intervene. You can see whether you have slack to sell, overload to fix, or margin quietly leaking through non-billable work.
You should aim for the commonly accepted 70–80% range, but treat it as a reference point, not a rigid rule. Your mix of training, business development, and creative work matters. Sustainable output will always outperform squeezing every possible billable minute out of your team.
Start simple. Use a template to establish consistent month-to-month visibility. Then improve the system. Automate where it reduces manual errors and saves time, but keep governance tight. Your process should align with employee monitoring data protection principles, stay transparent, and reinforce trust. Utilization works best when it drives better conversations, not surveillance.
Most importantly, act on what you see. Review utilization on a short cadence. Look at trends with your managers. Rebalance workloads, reforecast client scope, or invest in training before small gaps turn into missed revenue or employee burnout. When you combine disciplined measurement with ethical tracking and timely adjustments, utilization becomes a lever for stronger margins and healthier teams.
If you want greater accuracy without the spreadsheet overhead, you can automate the process. Flowace pricing plans start at $1.99 per user per month (billed annually) and include silent tracking, attendance automation, and burnout alerts.
If you’re ready to reduce admin time and get real-time visibility into billable performance, start a free trial or book a free demo with Flowace and see how streamlined utilization tracking can actually be.
FAQs:
1. What is a good utilization rate for an agency?
Most agencies aim for a 70–80% billable utilization rate.
- Below 65% may indicate underused capacity or too much internal work.
- Above 85–90% can increase burnout risk and reduce long-term sustainability.
The ideal benchmark depends on your service mix, training needs, and business development workload.
2. What’s the difference between resource utilization and billable utilization?
- Resource utilization measures total time spent working (billable + non-billable).
- Billable utilization measures only revenue-generating hours.
Billable utilization directly impacts revenue, while resource utilization shows overall workload and capacity usage. Tracking both prevents misleading conclusions.
3. How often should agencies calculate utilization rate?
Monthly tracking is the minimum recommended frequency.
However, high-growth or project-heavy agencies benefit from weekly visibility to catch workload imbalances early. Real-time dashboards make it easier to identify trends before they impact margins.
4. How do you calculate utilization rate for part-time employees?
Adjust total available hours based on actual working capacity.
For example:
- A full-time employee: 40 hours/week
- A part-time employee: 20 hours/week
If a part-time employee logs 15 billable hours out of 20 available hours:
(15 ÷ 20) × 100 = 75% utilization
Always subtract PTO, sick days, and holidays from available capacity for accurate results.
5. Why does my agency’s utilization rate fluctuate?
Common causes include:
- Seasonal client demand
- Large internal initiatives (training, hiring, rebranding)
- Proposal development or business development periods
- Staff onboarding phases
- Poor project scope management
Tracking trends over several months helps distinguish temporary dips from structural inefficiencies.
6. Are spreadsheets enough for tracking utilization?
Spreadsheets work for very small teams but become inefficient as agencies scale.
Common issues include:
- Missed entries
- Rounding errors
- Delayed reporting
- Difficulty auditing data
- Manual consolidation overhead
As team size increases, automated dashboards provide more reliable and scalable tracking.